Free Access
Fig. 5
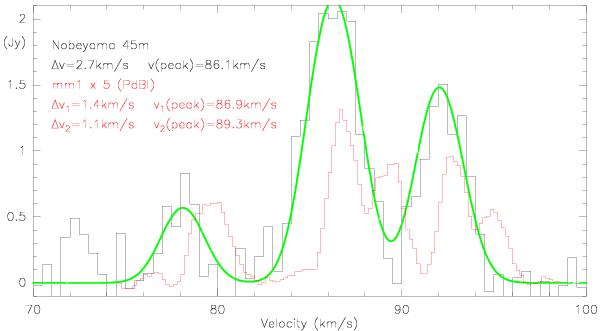
Compilation of N2H+(1 − 0) Nobeyama 45 m single-dish spectrum toward IRDC 18310 (black histogram with green fit) and PdBI spectrum toward mm1 (red histogram). The PdBI data are multiplied by 5 for clarity. Fit results to the whole N2H+(1 − 0) hyperfine structure are given in the panel.
Current usage metrics show cumulative count of Article Views (full-text article views including HTML views, PDF and ePub downloads, according to the available data) and Abstracts Views on Vision4Press platform.
Data correspond to usage on the plateform after 2015. The current usage metrics is available 48-96 hours after online publication and is updated daily on week days.
Initial download of the metrics may take a while.