Fig. 4
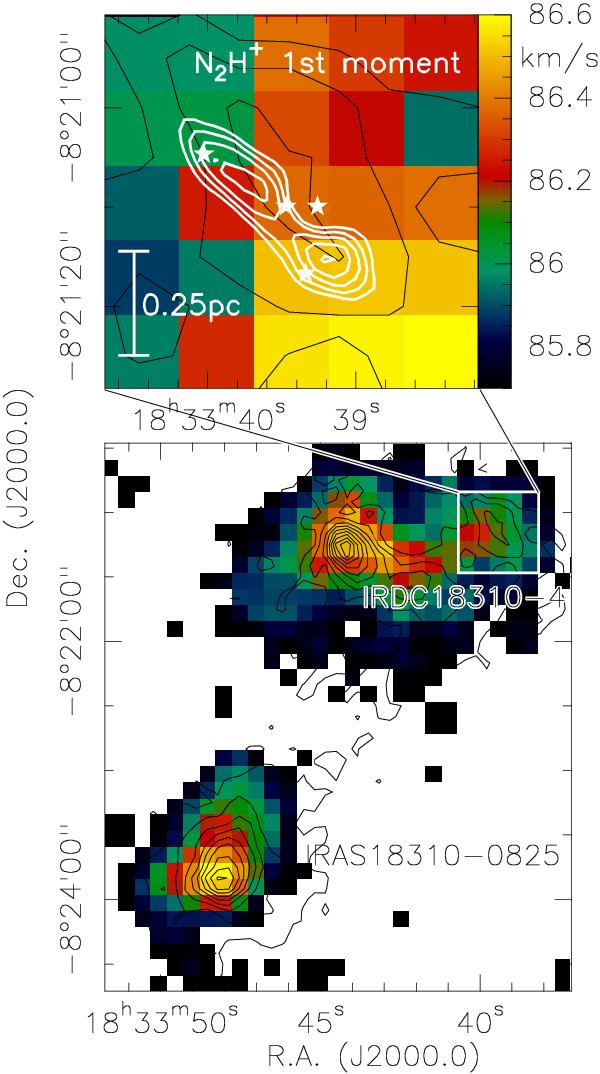
Bottom panel: integrated N2H+(1 − 0) emission (the whole hyperfine structure between 76 and 94 km s-1) observed with the Nobeyama 45 m telescope toward the entire complex containing IRAS 18310-0825 in the south-east and IRDC 18310-4 in the north-west. The contours show the 1.2 mm continuum data presented first by Beuther et al. (2002). The contouring is from 10 to 90% of the peak emission of 400 mJy beam-1. Top panel: zoom into IRDC 18310-4 where the color scale presents a 1st moment map (intensity-weighted peak velocity) of the main hyperfine component complex between 84 and 90 km s-1. The black contours are the same 1.2 mm map as in the bottom panel, and the white contours outline the 70 μm extinction feature. The stars mark the positions of the four PdBI 3.2 mm sources.
Current usage metrics show cumulative count of Article Views (full-text article views including HTML views, PDF and ePub downloads, according to the available data) and Abstracts Views on Vision4Press platform.
Data correspond to usage on the plateform after 2015. The current usage metrics is available 48-96 hours after online publication and is updated daily on week days.
Initial download of the metrics may take a while.