Fig. 10
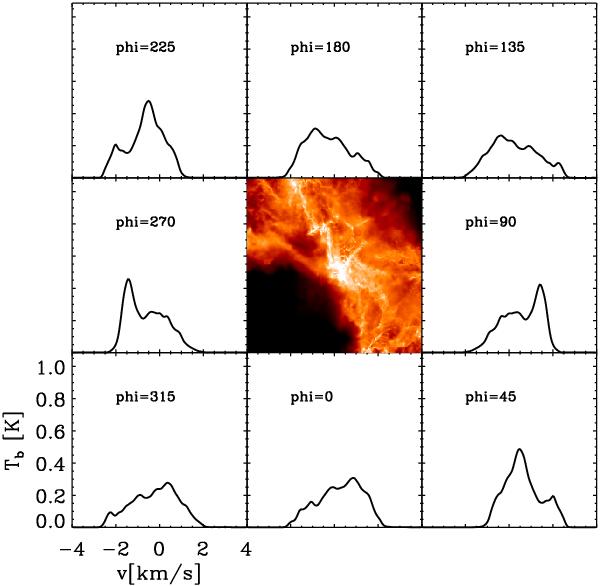
N2H+ (1−0) isolated hyperfine line profiles viewed through various lines of sight through a massive star forming region. The central image with a side-length of 0.8 pc shows the column density of the region and the surrounding line profiles are calculated for a 0.09 pc beam centered directly on the embedded core and viewed along the direction each panel touches the central image.
Current usage metrics show cumulative count of Article Views (full-text article views including HTML views, PDF and ePub downloads, according to the available data) and Abstracts Views on Vision4Press platform.
Data correspond to usage on the plateform after 2015. The current usage metrics is available 48-96 hours after online publication and is updated daily on week days.
Initial download of the metrics may take a while.