Fig. 1
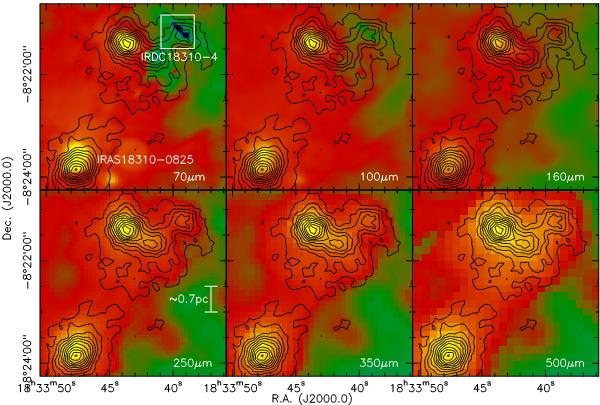
Compilation of the continuum data from 70 μm to 500 μm wavelength in color-scale as labeled in each panel. The scale is chosen in each image individually to highlight the most important features. Contour levels of the 870 μm data start at the 3σ levels of 0.189 mJy beam-1 and continue in in 3σ steps. The white small box in the top-left panel marks the smaller region discussed in the remaining figures. A scale-bar is shown in the bottom-left panel.
Current usage metrics show cumulative count of Article Views (full-text article views including HTML views, PDF and ePub downloads, according to the available data) and Abstracts Views on Vision4Press platform.
Data correspond to usage on the plateform after 2015. The current usage metrics is available 48-96 hours after online publication and is updated daily on week days.
Initial download of the metrics may take a while.