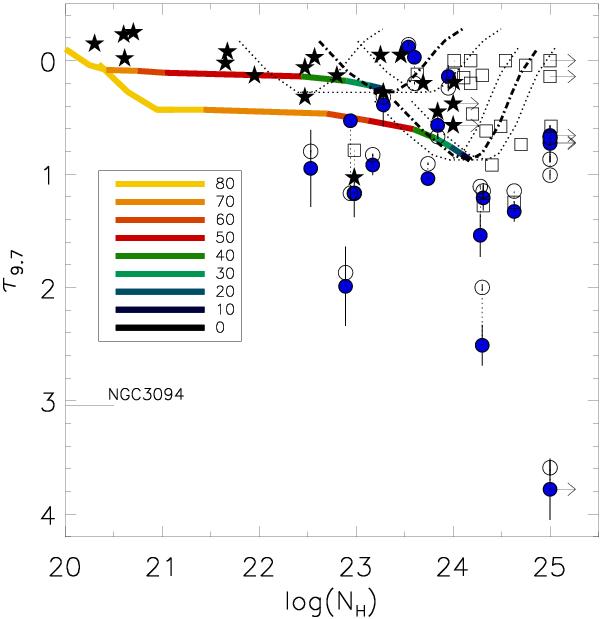
Fig. 7

Optical depth at 9.7 μm, τ9.7 versus logarithmic of the hydrogen column density at X-rays, NH. NH in units of cm-2. Symbols as in Fig. 6. Dot-dashed lines are the CLUMPY model predictions for i = 0° and No = [5,25] clouds. Dotted lines show how the curves evolve for the minimum and maximum number of clouds with a probability higher than 10% of intercepting the LOS. The coloured thick line show how the curve evolves when the viewing angle changes from i = 0° (black) to i = 80° (yellow). The dotted lines are the model that includes the Poisson probability of detecting a number of clouds along the ray (see text).
Current usage metrics show cumulative count of Article Views (full-text article views including HTML views, PDF and ePub downloads, according to the available data) and Abstracts Views on Vision4Press platform.
Data correspond to usage on the plateform after 2015. The current usage metrics is available 48-96 hours after online publication and is updated daily on week days.
Initial download of the metrics may take a while.


