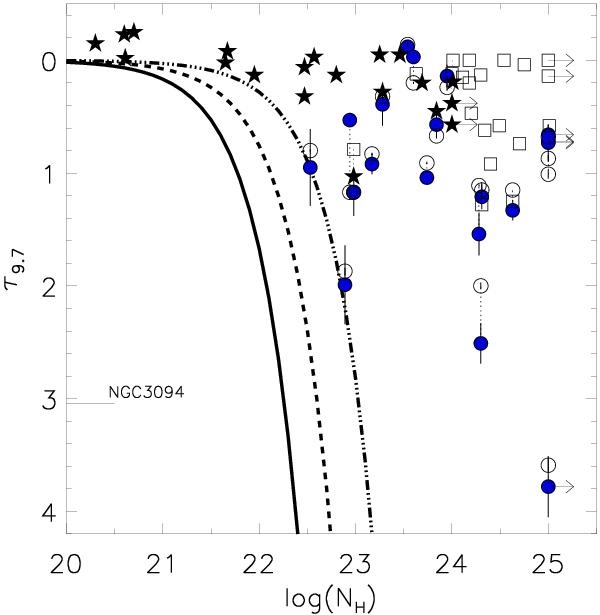
Fig. 6

Optical depth at 9.7 μm, τ9.7 versus logarithmic of the hydrogen column density at X-rays, NH. NH in units of cm-2. T-ReCS data are shown as blue-filled circles and the Spitzer/IRS data included in our work are shown as empty circles. The object without reported X-ray measurement is labelled as a short line in the Y-axis. Low limits on the NH are shown as right arrows. Compton-thick sources reported by Goulding et al. (2012) are shown as open squares, and AGN observed with VISIR/VLT by Hönig et al. (2010a) are shown as black-filled stars. Constant gas-to-dust ratio (i.e. the uniform dusty torus) assuming the viewing angles of i = 0,40,80° are shown with the continuous, dashed, and dot-dashed lines, respectively.
Current usage metrics show cumulative count of Article Views (full-text article views including HTML views, PDF and ePub downloads, according to the available data) and Abstracts Views on Vision4Press platform.
Data correspond to usage on the plateform after 2015. The current usage metrics is available 48-96 hours after online publication and is updated daily on week days.
Initial download of the metrics may take a while.


