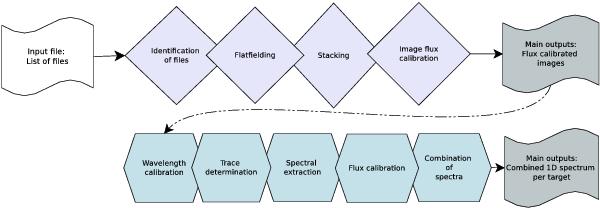
Fig. 1

Flowchart of the RedCan procedure. Diamonds are the steps in the imaging procedure, while polygons indicate the steps in the spectroscopic procedure. The empty flag is the input level and the dark grey flags indicate the output levels. The dashed arrow is set to point out that RedCan continues from imaging to spectroscopic procedures only when spectra are included in the initial dataset.
Current usage metrics show cumulative count of Article Views (full-text article views including HTML views, PDF and ePub downloads, according to the available data) and Abstracts Views on Vision4Press platform.
Data correspond to usage on the plateform after 2015. The current usage metrics is available 48-96 hours after online publication and is updated daily on week days.
Initial download of the metrics may take a while.


