Fig. 6
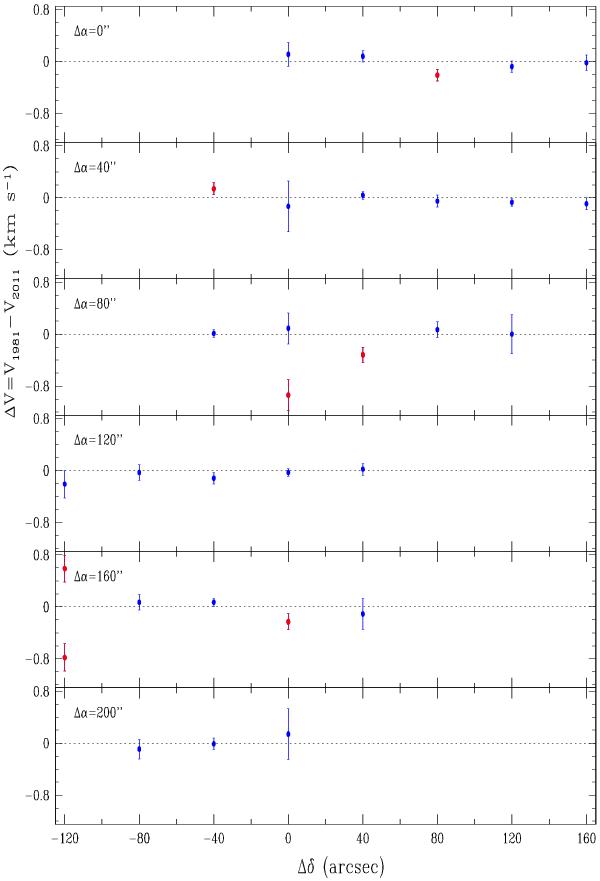
Dots with 3σ error bars mark the differences between the radial velocities measured with the Effelsberg 100-m telescope in 1977–1981 (Ungerechts & Güsten 1984) and in the present dataset toward the same positions in Do279P12. The red points indicate deviations from zero that are larger than 3σ. At two offsets, (Δα,Δδ) = (80′′,0′′) and (160′′, − 120′′), we detected double NH3 profiles (see Fig. B.4).
Current usage metrics show cumulative count of Article Views (full-text article views including HTML views, PDF and ePub downloads, according to the available data) and Abstracts Views on Vision4Press platform.
Data correspond to usage on the plateform after 2015. The current usage metrics is available 48-96 hours after online publication and is updated daily on week days.
Initial download of the metrics may take a while.