Free Access
Fig. B.1
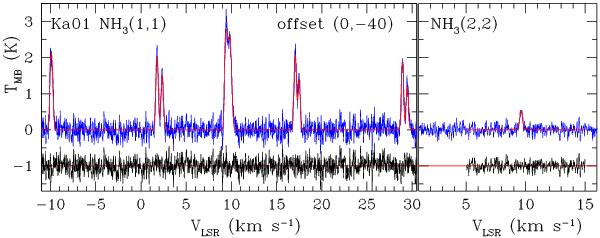
Ammonia (1, 1) and (2, 2) spectra (blue) toward the source Ka01. The channel spacing is 0.015 km s-1, the spectral resolution FWHM = 0.024 km s-1. The red curves show the fit of a single-component Gaussian model to the original data. The residuals between the observed and model spectra are shown in black.
Current usage metrics show cumulative count of Article Views (full-text article views including HTML views, PDF and ePub downloads, according to the available data) and Abstracts Views on Vision4Press platform.
Data correspond to usage on the plateform after 2015. The current usage metrics is available 48-96 hours after online publication and is updated daily on week days.
Initial download of the metrics may take a while.