Fig. 4
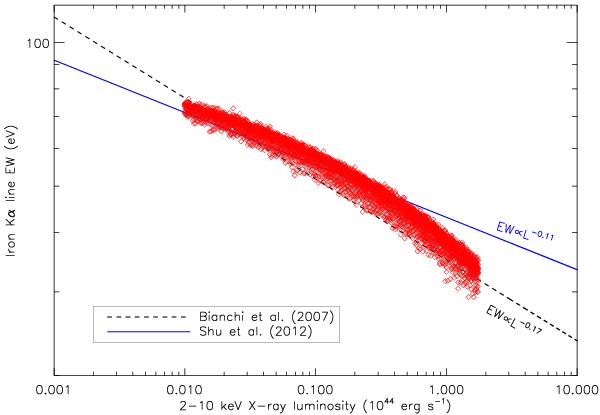
Equivalent width of the iron Kα line versus the X-ray luminosity
obtained simulating a torus with an equatorial column density of
 and a covering
factor decreasing with the luminosity. The
θOA − LX relationship used
here is that of Hasinger (2008; see Fig. 2). The relations of Bianchi et al.
(2007, black dashed line) and Shu et al. (2012, blue line, obtained averaging different observations of the same
source) are also shown for comparison (see also Table 1). The normalization of the relation of Bianchi et al. (2007) has been fixed to an arbitrary value for
comparison.
and a covering
factor decreasing with the luminosity. The
θOA − LX relationship used
here is that of Hasinger (2008; see Fig. 2). The relations of Bianchi et al.
(2007, black dashed line) and Shu et al. (2012, blue line, obtained averaging different observations of the same
source) are also shown for comparison (see also Table 1). The normalization of the relation of Bianchi et al. (2007) has been fixed to an arbitrary value for
comparison.
Current usage metrics show cumulative count of Article Views (full-text article views including HTML views, PDF and ePub downloads, according to the available data) and Abstracts Views on Vision4Press platform.
Data correspond to usage on the plateform after 2015. The current usage metrics is available 48-96 hours after online publication and is updated daily on week days.
Initial download of the metrics may take a while.