Fig. 28
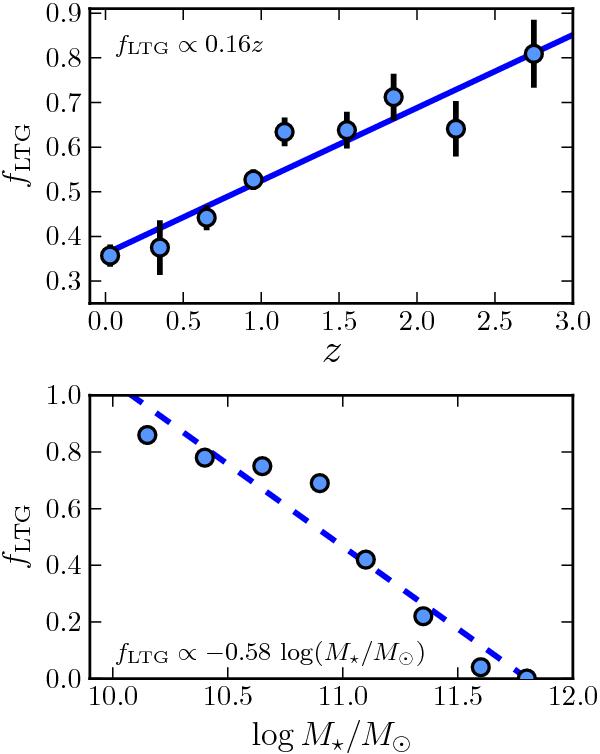
Fraction of late-type galaxies as a function of redshift (top panel) and stellar mass at z ~ 0 (bottom panel). The redshift data points are from Buitrago et al. (2013), and the stellar mass ones from Bernardi et al. (2010) in the SDSS. The line in both panels is the best least-squares linear fit to the data. (A colour version of this plot is available at the electronic edition)
Current usage metrics show cumulative count of Article Views (full-text article views including HTML views, PDF and ePub downloads, according to the available data) and Abstracts Views on Vision4Press platform.
Data correspond to usage on the plateform after 2015. The current usage metrics is available 48-96 hours after online publication and is updated daily on week days.
Initial download of the metrics may take a while.