Fig. 23
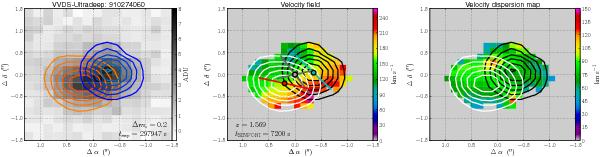
The same as Fig. 3, but for the MASSIV source 910274060 (major merger). The outer contour marks the 1.20 ADU (3σsky) isophote, while brighter isophotes increase in 1.00 ADU (2.5σsky) steps. The grey dot in the central figure marks the centre of the system given by the kinematical model, while the red/blue dot marks the photometric centre of the principal/companion galaxy given by the two-component model of the source. The long bars mark the position angle of the previous models. The short bar marks the photometric position angle given by the one-component model of the source. (A colour version of this plot is available at the electronic edition.)
Current usage metrics show cumulative count of Article Views (full-text article views including HTML views, PDF and ePub downloads, according to the available data) and Abstracts Views on Vision4Press platform.
Data correspond to usage on the plateform after 2015. The current usage metrics is available 48-96 hours after online publication and is updated daily on week days.
Initial download of the metrics may take a while.