Fig. 8
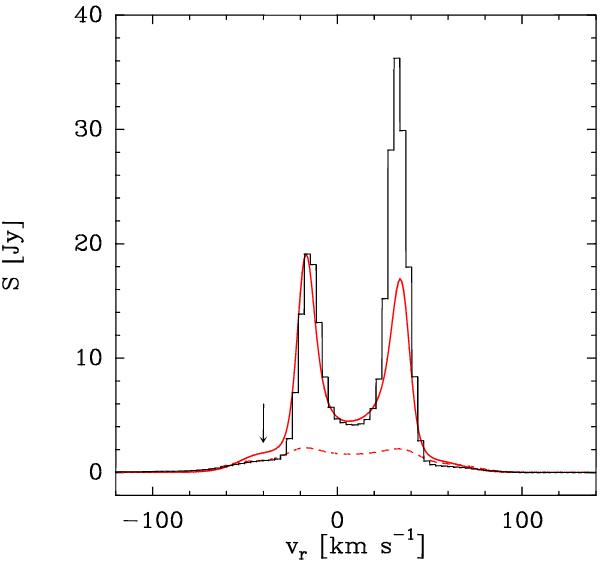
Observed (histogram) and modelled profiles (lines) of the H30α. The red dashed line is the best profile obtained by using the Walmsley departure coefficients (with the input parameter values as given in Martín-Pintado et al. 2011), while the solid red line is the modelled profile obtained with the set of input parameters shown in Table 1 and by using the Storey & Hummer bn coefficients. The derived amplification assuming the Walmsley coefficients is lower because of their lower negative βmn values (see Fig. 2). The arrow indicates the wing hump at the blue-shifted velocities.
Current usage metrics show cumulative count of Article Views (full-text article views including HTML views, PDF and ePub downloads, according to the available data) and Abstracts Views on Vision4Press platform.
Data correspond to usage on the plateform after 2015. The current usage metrics is available 48-96 hours after online publication and is updated daily on week days.
Initial download of the metrics may take a while.