Fig. 8
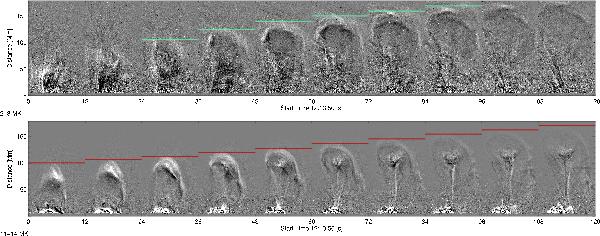
Running differences of the DEM maps (ξ(T,x,y,ti) − ξ(T,x,y,ti − 1)) for 2–3 MK (top row) and 11–14 MK (bottom row), with white showing an increase in DEM, black a decrease. The leading edge of the erupting plasma was tracked and is indicated by the red horizontal lines The resulting height profiles as a function of time for these and other temperature ranges is shown in Figs. 9 and 10. These maps have been rotated by 110°.
Current usage metrics show cumulative count of Article Views (full-text article views including HTML views, PDF and ePub downloads, according to the available data) and Abstracts Views on Vision4Press platform.
Data correspond to usage on the plateform after 2015. The current usage metrics is available 48-96 hours after online publication and is updated daily on week days.
Initial download of the metrics may take a while.