Open Access
Fig. 7
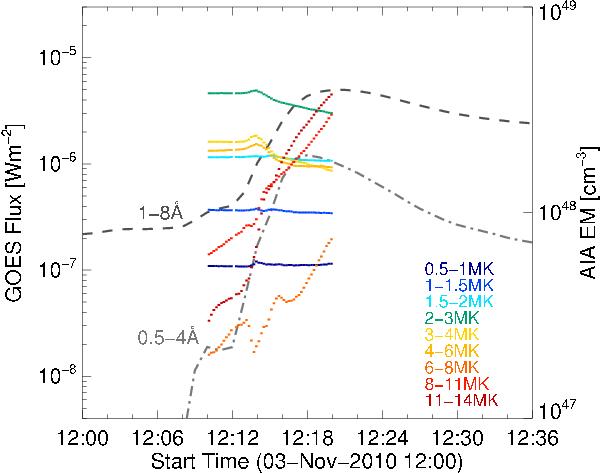
GOES SXR lightcurve of the 3-Nov-2010 flare C4.9 (grey lines) with the spatially integrated emission measures derived from the SDO/AIA observations for the chosen temperature ranges (coloured lines).
Current usage metrics show cumulative count of Article Views (full-text article views including HTML views, PDF and ePub downloads, according to the available data) and Abstracts Views on Vision4Press platform.
Data correspond to usage on the plateform after 2015. The current usage metrics is available 48-96 hours after online publication and is updated daily on week days.
Initial download of the metrics may take a while.