Fig. 6
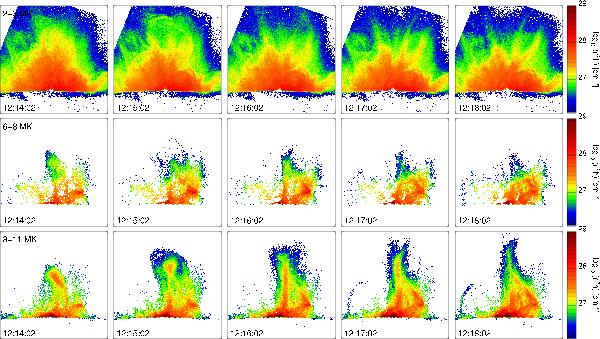
Emission measure maps for various times in 2–3 MK, 6–8 MK, and 8–11 MK (top, middle, bottom rows). These maps have been rotated by 110°. The second column is of the time interval shown in previous figures. A movie of this is available with the electronic version of this paper, covering the 1–1.5 to 14–19 MK from 12:12:02 UT to 12:19:52 UT, see Fig. A.1.
Current usage metrics show cumulative count of Article Views (full-text article views including HTML views, PDF and ePub downloads, according to the available data) and Abstracts Views on Vision4Press platform.
Data correspond to usage on the plateform after 2015. The current usage metrics is available 48-96 hours after online publication and is updated daily on week days.
Initial download of the metrics may take a while.