Fig. 3
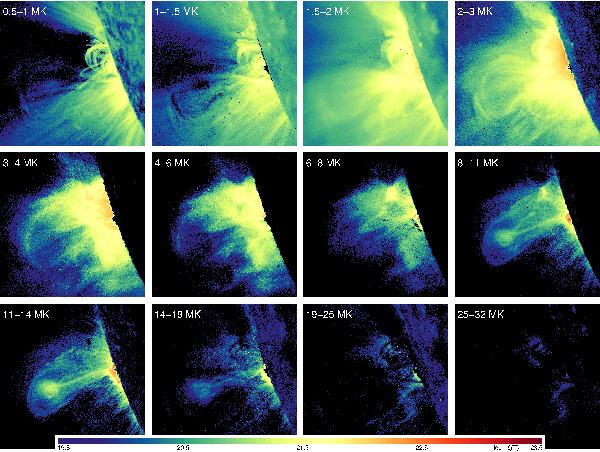
DEM maps in different temperature ranges for the 3-Nov-2010 flare at 12:15:02 UT. The same pixel position in the twelve maps corresponds to the regularized DEM solution ξ(T) (as shown in detail for eight pixel positions in Fig. 2) to the set of data values from the corresponding pixel in the six images shown in Fig. 1. The colour scale is log ξ(T) and is in units of cm-5 K-1.
Current usage metrics show cumulative count of Article Views (full-text article views including HTML views, PDF and ePub downloads, according to the available data) and Abstracts Views on Vision4Press platform.
Data correspond to usage on the plateform after 2015. The current usage metrics is available 48-96 hours after online publication and is updated daily on week days.
Initial download of the metrics may take a while.