Fig. 2
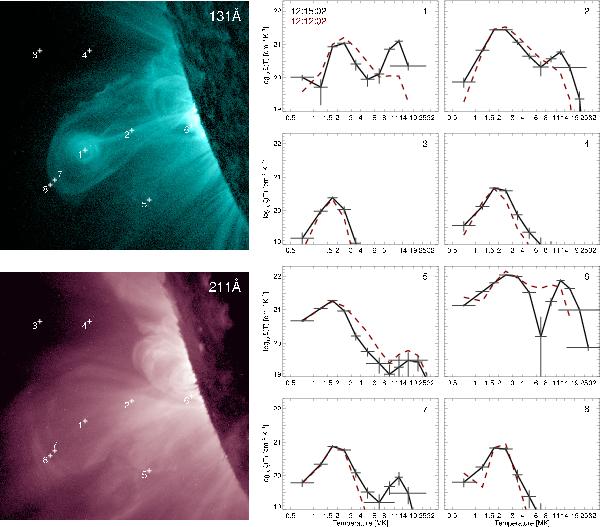
Left: SDO/AIA 131 Å and 211 Å images from Fig. 1 with eight pixels highlighted. Right: the corresponding regularized DEM solutions ξ(T) (using twelve temperature bins) and the vertical Δξ(T) and horizontal Δlog T errors (the maximum of the error from the resolution matrix or the temperature bin width) for the highlighted pixels using the data from all six image in Fig. 1. The dashed lines show the DEM solutions in those pixels before the eruption at 12:12:02 UT, whereas the solid lines are from 12:15:02 UT.
Current usage metrics show cumulative count of Article Views (full-text article views including HTML views, PDF and ePub downloads, according to the available data) and Abstracts Views on Vision4Press platform.
Data correspond to usage on the plateform after 2015. The current usage metrics is available 48-96 hours after online publication and is updated daily on week days.
Initial download of the metrics may take a while.