Fig. 4
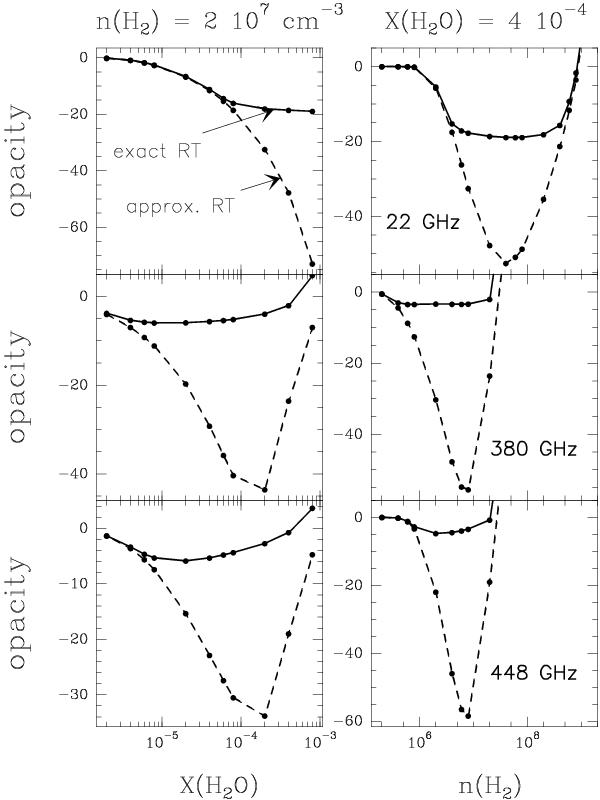
Comparison between the opacities derived with (solid lines) or without (dashed lines) accounting for maser propagation for the masers at 22 GHz, 380 GHz, and 448 GHz. The left column corresponds to a cut in density at n(H2) = 2 × 107 cm-3; the differences are shown with respect to variations in X(H2O). The right column corresponds to a fixed water abundance, i.e. X(H2O) = 4 × 10⁻⁴.
Current usage metrics show cumulative count of Article Views (full-text article views including HTML views, PDF and ePub downloads, according to the available data) and Abstracts Views on Vision4Press platform.
Data correspond to usage on the plateform after 2015. The current usage metrics is available 48-96 hours after online publication and is updated daily on week days.
Initial download of the metrics may take a while.