Fig. 3
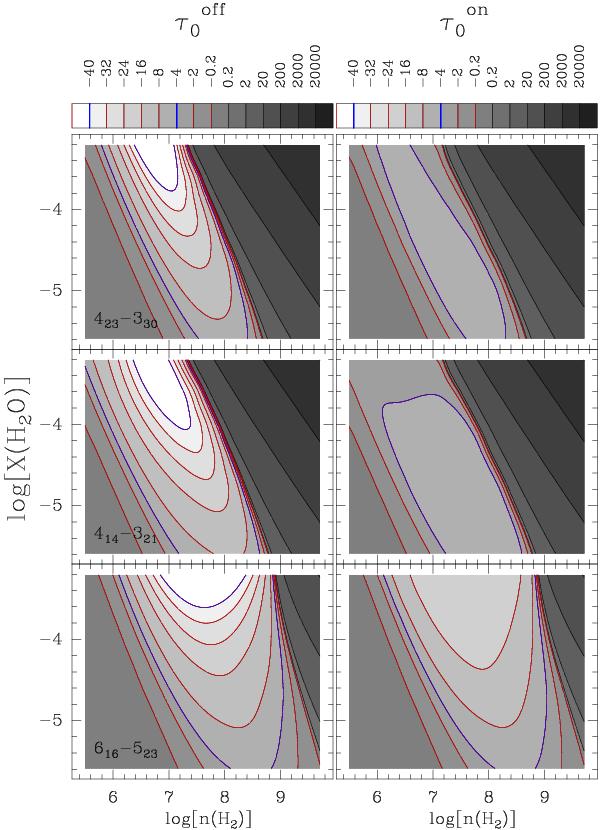
Isocontours of the o–H2O opacities at line centre for the 616 − 523 line at 22 GHz, the 414 − 321 line at 380 GHz, and the 423 − 330 line at 448 GHz. The left column corresponds to the models where the treatment of maser propagation is omitted and the right column to the current results (see text). The isocontour values and the correspondence between grey scale and opacity values are displayed at the top of the two columns. The isocontours that correspond to opacities of − 4 and − 40 are displayed in thick blue lines. Negative values for the opacity correspond to red lines.
Current usage metrics show cumulative count of Article Views (full-text article views including HTML views, PDF and ePub downloads, according to the available data) and Abstracts Views on Vision4Press platform.
Data correspond to usage on the plateform after 2015. The current usage metrics is available 48-96 hours after online publication and is updated daily on week days.
Initial download of the metrics may take a while.