Fig. 4
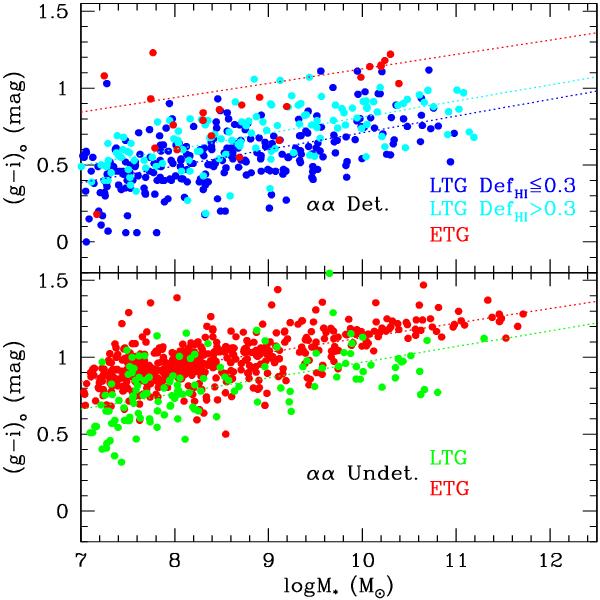
Top panel: (g − i)o color (corrected for internal extinction) vs. stellar mass diagram of Hα3 galaxies detected by ALFALFA (isolated+Virgo), color–coded by morphology (red = ETGs, blue+cyan = LTGs). Bottom panel: color–mass diagram of galaxies not in Hα3 (undetected by ALFALFA). They have been optically selected from NED among isolated objects, and from the VCC within the Virgo cluster (red = ETG; green = LTG). In both panels the diagonal dashed red lines mark the loci of the red sequence. The 26 LTGs in the VCC, undetected by ALFALFA, with log M∗ > 9.0 are listed in Table 1.
Current usage metrics show cumulative count of Article Views (full-text article views including HTML views, PDF and ePub downloads, according to the available data) and Abstracts Views on Vision4Press platform.
Data correspond to usage on the plateform after 2015. The current usage metrics is available 48-96 hours after online publication and is updated daily on week days.
Initial download of the metrics may take a while.