Fig. 2
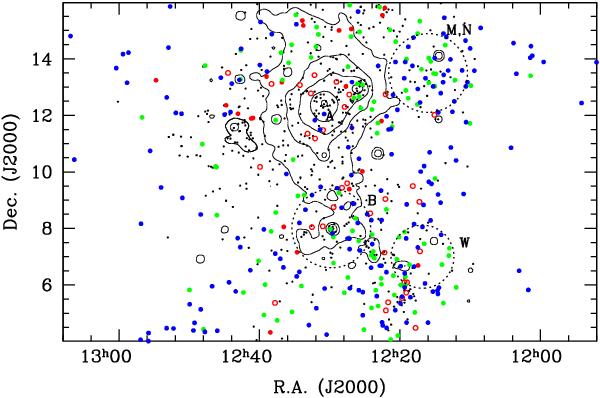
Sky distribution of galaxies around the Virgo cluster. ETGs (from the VCC with mp < 18.0 mag) are given with small black dots. HI-selected LTG galaxies, coded according to their HI deficiency parameter (red dots: DefHI > 0.9; green dots: 0.3 < DefHI < 0.9; blue dots DefHI ≤ 0.3). The empty red circles represent the 26 LTGs undetected by ALFALFA listed in Table 1. Superposed are the X-ray contours from ROSAT (Böhringer et al. 1994). The position of cluster A (M 87), B (M 49) and of clouds M, N and W are given. Clouds M and N coincide in position but have significantly different distance moduli.
Current usage metrics show cumulative count of Article Views (full-text article views including HTML views, PDF and ePub downloads, according to the available data) and Abstracts Views on Vision4Press platform.
Data correspond to usage on the plateform after 2015. The current usage metrics is available 48-96 hours after online publication and is updated daily on week days.
Initial download of the metrics may take a while.