Fig. 1
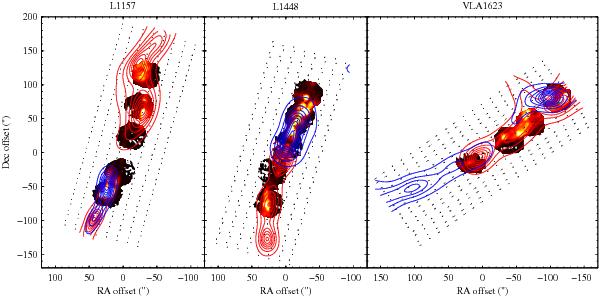
Colourmaps of the sum of the H2 S(0)–S(7) emission (normalized to 1 × 10⁻³ erg cm-2 s-1 sr-1) and contours of the H2O (110−101) emission are overlaid. Red contours are from 0.06 to 19 K km s-1, 0.09 to 55 K km s-1, and 0.05 to 7.9 K km s-1 for L 1157, L 1448, and VLA 1623, respectively. Blue contours for the same sources are from 0.06 to 69 K km s-1, 0.09 to 23 K km s-1, and 0.06 to 10 K km s-1. Offsets in the maps are with respect to the central sources, with coordinates tabulated in Table 1. The black dots indicate the readout positions for the OTF maps.
Current usage metrics show cumulative count of Article Views (full-text article views including HTML views, PDF and ePub downloads, according to the available data) and Abstracts Views on Vision4Press platform.
Data correspond to usage on the plateform after 2015. The current usage metrics is available 48-96 hours after online publication and is updated daily on week days.
Initial download of the metrics may take a while.