| Issue |
A&A
Volume 552, April 2013
|
|
|---|---|---|
| Article Number | L10 | |
| Number of page(s) | 5 | |
| Section | Letters | |
| DOI | https://doi.org/10.1051/0004-6361/201321134 | |
| Published online | 12 April 2013 | |
A candidate circumbinary Keplerian disk in G35.20–0.74 N: A study with ALMA
1
INAF, Osservatorio Astrofisico di Arcetri, Largo E. Fermi 5,
50125
Firenze,
Italy
e-mail: This email address is being protected from spambots. You need JavaScript enabled to view it.
2
Centro de Astrofísica da Universidade do Porto,
Rua das Estrelas, 4150-762
Porto,
Portugal
3
ESO, Karl-Schwarzschild-Strasse 2, 85748
Garching bei München,
Germany
4
SOFIA Science Center, NASA Ames Research Center, Mailstop
232-12, Moffett
Field, CA
94035,
USA
5
Jodrell Bank Centre for Astrophysics, School of Physics and
Astronomy, University of Manchester, Manchester
M13 9PL,
UK
6
Hamburger Sternwarte, Gojenbergsweg 112,
21029
Hamburg,
Germany
7
Universitäts-Sternwarte München,
Ludwig-Maximilians-Universität, Scheinerstrasse 1, 81679
München,
Germany
8
SRON Netherlands Institute for Space Research,
PO Box 800, 9700 AV
Groningen, The
Netherlands
9
Kapteyn Astronomical Institute, University of
Groningen, 9700
AV
Groningen, The
Netherlands
10
Department of Earth and Space Science, Indian Institute of Space
Science and Technology, Thiruvananthapuram, 695
547
Kerala,
India
11 Dublin Institute for Advanced Studies (DIAS), 31
Fitzwilliam Place, Dublin 2, Ireland
12
Leiden Observatory, Leiden University,
PO Box 9513, 2300 RA
Leiden, The
Netherlands
Received: 19 January 2013
Accepted: 15 March 2013
Abstract
We report on ALMA observations of continuum and molecular line emission with 0."4 resolution towards the high-mass star-forming region G35.20–0.74 N. Two dense cores are detected in typical hot-core tracers (e.g., CH3CN) that reveal velocity gradients. In one of these cores, the velocity field can be fitted with an almost edge-on Keplerian disk rotating about a central mass of ~18 M⊙. This finding is consistent with the results of a recent study of the CO first overtone bandhead emission at 2.3 μm towards G35.20–0.74 N. The disk radius and mass are ≳2500 au and ~3 M⊙. To reconcile the observed bolometric luminosity (~3 × 10⁴ L⊙) with the estimated stellar mass of 18 M⊙, we propose that the latter is the total mass of a binary system.
Key words: stars: formation / ISM: individual objects: G35.20-0.74N / ISM: jets and outflows
© ESO, 2013
1. Introduction
While different scenarios have been proposed to explain the formation of high-mass (i.e. OB-type) stars (monolithic collapse in a turbulence-dominated core – Krumholz et al. 2009; competitive accretion driven by a stellar cluster – Bonnell & Bate 2006; Bondi-Hoyle accretion – Keto 2007; see also the review by Zinnecker & Yorke 2007), all of them predict the formation of circumstellar disks. It is thus surprising that only a handful of disk candidates have been observed in association with massive (proto)stars. As a matter of fact, despite many observational efforts, convincing evidence of disks has been found only around early B-type (proto)stars, while circumstellar disks around O-type stars remain elusive (Wang et al. 2012; Cesaroni et al. 2007 and references therein). Moreover, a detailed investigation of the disk properties, comparable to those performed in disks around low-mass stars (e.g. Dutrey et al. 2007) is still missing due to the large distances of OB-type (proto)stars and the limited angular resolution at (sub)millimeter wavelengths. With the advent of the Atacama Large Millimeter Array (ALMA), the situation is bound to improve dramatically, since resolutions ≪ 1′′ will be easily obtained.
With this in mind, we performed ALMA Cycle 0 observations of two IR sources containing B-type (proto)stars. These were chosen on the basis of their luminosities (on the order of 104 L⊙), presence of bipolar nebulosities/outflows, detection of broad line wings in typical jet/outflow tracers (SiO), and strong emission in hot molecular core (HMC) tracers (such as methyl cyanide, CH3CN). Here we present the most important results obtained for one of the two sources, G35.20–0.74 N.
G35.20–0.74 N is a well known star-forming region located at a distance of  kpc (Zhang et al. 2009), with a luminosity of ~3 × 10⁴ L⊙1. The region is characterized by a butterfly shaped reflection nebula oriented NE–SW (see Fig. 1), as well as a bipolar molecular outflow in the same direction, observed in 12CO by Dent et al. (1985a), Gibb et al. (2003; hereafter GHLW), Birks et al. (2006; hereafter BFG), and López-Sepulcre et al. (2009). The 12CO(1–0) line emission also appears to trace a N–S collimated flow (see BFG), coinciding with a thermal radio jet (Heaton & Little 1988; GHLW) seen also at IR wavelengths (Dent et al. 1985b; Walther et al. 1990; Fuller et al. 2001; De Buizer 2006; Zhang et al. 2013). It has been proposed that the poorly collimated NE–SW outflow and the N−S jet could be manifestations of the same bipolar flow undergoing precession (Little et al. 1998). However, evidence for multiple outflows in this region is provided by SiO, H13CO+, H13CN, and H2 line observations (GHLW; Lee et al. 2012).
A molecular clump elongated perpendicular to the NE–SW outflow has been mapped in dense gas tracers (NH3, CS), whose emission exhibits a velocity gradient from NW to SE (Little et al. 1985; Brebner et al. 1987). This was first interpreted as a large (~1′ or 0.6 pc) disk/toroid rotating about the NE–SW outflow axis, but on the basis of their H13CO+ and H13CN observations, GHLW propose that this is actually a fragmented rotating envelope containing multiple young stellar objects (YSOs). Indeed, GHLW identify a core at the center of the outflow and another core, named G35MM2, offset to the SE.
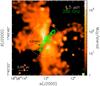 |
Fig. 1 Large-scale image of the 4.5 μm emission towards the star-forming region G35.20–0.74 N overlaid with a contour map of the 350 GHz continuum emission obtained with ALMA. The IR image has been obtained by applying HiRes deconvolution (Velusamy et al. 2008) to the Spitzer/IRAC data. The sub-mm map has been corrected for primary beam attenuation. The contours range from 9 to 203 mJy/beam in steps of 10.8 mJy/beam. The dashed circle denotes the primary beam of the ALMA 12-m antennas. The ellipse in the bottom right is the ALMA synthesized beam. |
2. Observations and results
G35.20–0.74 N was observed with ALMA Cycle 0 at 350 GHz in May and June 2012 with baselines in the range 36–400 m, providing sensitivity to structures ≤ 2′′. The digital correlator was configured in four spectral windows (with dual polarization) of 1875 MHz and 3840 channels each (covering the ranges 334.85–338.85 GHz and 346.85–350.85 GHz), providing a resolution of ~0.4 km s-1. Flux, gain, and bandpass calibrations were obtained through observations of Neptune and J1751 + 096. The data were calibrated and imaged using CASA. A continuum map was obtained from line-free channels and subtracted from the data. The synthesized beam is  , PA = 48°. The rms noise is ~6 mJy beam-1 for individual line channels, while in the continuum image, it is ~1.8 mJy beam-1, implying a S/N of only ~100. The latter indicates a reduced dynamic range.
In Fig. 1, we present the map of the 350 GHz continuum emission overlaid on an enhanced resolution Spitzer/IRAC image at 4.5 μm extracted from the GLIMPSE survey (Benjamin et al. 2003). The sub-mm continuum emission is clearly tracing an elongated structure across the waist of the butterfly-shaped nebula. In all likelihood, we are detecting the densest part of the flattened molecular structure observed on a larger scale by Little et al. (1985), Brebner et al. (1987), and GHLW.
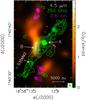 |
Fig. 2 Same as Fig. 1, with the 3.6 cm continuum map by GHLW overlaid (magenta contours). Unlike Fig. 1, the 4.5 μm image is displayed using linear scaling to emphasize the brightest structures outlining the N–S jet. Cores A, B, and G35MM2 are indicated by the arrows. |
Along the elongated structure a chain of at least five cores is seen (Fig. 2), lending support to GHLW’s idea that one is dealing with a fragmented structure instead of the smooth disk or toroid hypothesized by Little et al. (1985). We stress that the angular resolution of our maps (~7 times better than previous (sub)millimeter observations) reveals that the YSOs powering the outflow(s) lie inside cores A and/or B (see Fig. 2), because these two are the only cores located close to the geometrical center of the bipolar nebula. In particular, core B lies along the N−S jet traced by the IR and radio emission, and coincides with one of the free-free sources detected by GHLW. The hypothesis by BFG that core G35MM2 could be driving the NE–SW outflow is not convincing, because this core is off-center, lying right at the border of the waist outlined by the IR emission.
Methyl cyanide emission (as well as other typical HMC tracers) is clearly detected only towards cores A and B, and marginally towards G35MM2. Emission by vibrationally excited lines of CH3CN also indicates that cores A and B could be hosting massive stars. Core B also coincides with a compact free-free continuum source detected by GHLW at 6 cm and 3.6 cm, and by Codella et al. (2010) at 1.3 cm. This emission could be part of the N–S thermal radio jet or might be coming from an Hii region ionized by an embedded early-type star. We discuss this possibility in Sect. 4. Faint radio emission at a 5.6σ level is also detected towards core A, consistent with the presence of one or more embedded star.
We now investigate the gas velocity field in the two cores by computing the first moment of a CH3CN line, a dense gas tracer. Figure 3 plots the result for the CH3CN(19–18) K = 2 line, with the line emission overlaid that is averaged over the same velocity interval used to calculate the first moment. The mean velocity of core B (~30 km s-1) differs by ~2 km s-1 from that of core A (~32 km s-1), which also differs by a similar amount from what is obtained (~34 km s-1) with lower angular resolution observations of other tracers (see e.g. GHLW). Discrepancies of this type are often found in high-mass star-forming regions (see, e.g., the case of AFGL5142 – Estalella et al. 1993; Zhang et al. 2007) and are very likely related to the fragmentation process in molecular clumps. The interesting result is that both cores present velocity gradients, which may be due to expansion or rotation of the gas. The sense of the gradient in core B is the opposite of what is measured on larger scales (see Fig. 5 of Little et al. 1985, and Figs. 8 and 9 of GHLW). However, the velocity range traced by the extended emission (30–41 km s-1) differs significantly from the range sampled by the CH3CN lines (~26–38 km s-1), suggesting that we are observing cores whose velocity field is not tightly related to that of the largest, fragmenting structure where they are embedded. In the following, we address this question for core B, which is better resolved and associated with the N–S jet/outflow.
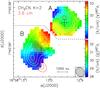 |
Fig. 3 Overlay of the average emission in the CH3CN(19–18) K = 2 line (white contours) and 3.6 cm free-free continuum emission (red contours; from GHLW) on a map of the first moment (i.e. velocity) of the same CH3CN line. The velocity intervals used to calculate the mean emission and first moment are 25.9−38.0 km s-1 for core A and 25.9−33.0 km s-1 for core B. The dashed line is intended to stress that different color scales are used for the two cores to emphasize the velocity gradients. The white contour levels range from 80 to 656 mJy/beam in steps of 96 mJy/beam. The crosses mark the positions of the 350 GHz continuum peaks. The ellipse in the bottom right indicates the synthesized beam. |
3. The nature of core B: A Keplerian rotating disk?
An elongated structure with a velocity gradient along its major axis, such as the one observed in core B, can be interpreted as either a collimated bipolar outflow or a rotating ring/disk seen close to edge on. We thus first investigate the possibility that we are observing the root of a large-scale bipolar outflow.
At first glance, both the orientation (see Fig. 2) and sign of the velocity gradient seen in Fig. 3 appear consistent with those of the N–S jet imaged by BFG (see the red-shifted emission at 40 km s-1 in their Fig. 3). However, the CO emission in the northern jet lobe is also detected by BFG at 28 km s-1 (see their Fig. 3), namely at blue-shifted velocities. Moreover, the direction of the CH3CN velocity gradient has a negative position angle, whereas the jet is slightly inclined to the east. Such a difference could be explained if the jet is precessing (as suggested by BFG) and lies close to the plane of the sky, because the jet direction would change from the small to the large scale. We believe that this explanation is not satisfactory, because the orientation of the CH3CN velocity gradient differs from that of the radio jet on the same scale. This can be seen in Fig. 3, where the two free-free emission sources are aligned N–S, whereas the velocity gradient (and the core major axis) are inclined to the W (PA ≃ –20°).
Based on these findings, we consider the alternative possibility that the velocity gradient is tracing a disk. To analyze the kinematics of the gas in more detail, we fitted the CH3CN emission in each 0.4 km s-1 velocity channel with a 2D Gaussian. This allowed us to derive the peaks of the line emission at different velocities. Then all peaks can be plotted together to obtain a picture of the gas velocity field. This is done in Fig. 4a, where for each peak we also plot the corresponding 50% contour level to give an idea of the size of the gas emitting at that velocity.
Two considerations are in order. The first is that the peaks outline a sort of elliptical pattern, roughly centered on the position of the continuum peak and oriented SSE–NNW. The second is that the most blue- and red-shifted peaks tend to converge towards the position of the sub-mm continuum peak. On this basis, one is tempted to hypothesize that the CH3CN emission is tracing Keplerian-like rotation, since this would explain why the emission both at systemic velocities and at high (blue- and red- shifted) velocities are observed towards the rotation center.
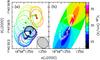 |
Fig. 4 a) Peaks of the CH3CN(19–18) K = 2 line emission (solid circles) obtained with a 2D Gaussian fit channel by channel. For each peak the corresponding 50% contour level is also drawn (using the same color as the peak). The color corresponds to the line-of-sight velocity, according to the scale displayed to the right. The ellipse in the bottom right denotes the synthesized beam. b) Comparison between the velocity of the best-fit Keplerian disk (color map) and the emission peaks at different velocities (solid circles) obtained for the following lines: CH3CN(19–18) K = 2,3,4, CH3OH(71,6–61,5) vt = 1, CH3OH(141,13–140,14), and HC3N(37–36). The crosses mark the position of the continuum peak. |
With this in mind, we fitted the observed velocity pattern assuming Keplerian rotation about a point-like source. We stress that ours is a purely kinematical fit, where only the rotation velocity in a 2D disk is calculated, and no estimate of the observed line intensity was computed. Also, no attempt was made to demonstrate the uniqueness of the model proposed, and we envisage the possibility that other interpretations might be possible. Our simple model is sufficient to constrain a number of important parameters. The inputs of the model are the LSR velocity of the system (Vsys), the central point mass (M ∗ ) and its position (x0,y0), the inclination angle (θ) of the rotation axis with respect to the plane of the sky, and the position angle (ψ) of the projected major axis of the disk.
The best fit was obtained by varying all input parameters inside reasonable ranges and minimizing the expression 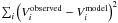 where i indicates the peak in a generic velocity channel. For our calculations, we used the K = 2,3, and 4 components of the CH3CN(19–18) transition, as well as other prominent lines of other species, such as CH3OH(71,6−61,5) vt = 1, CH3OH(141,13–140,14), and HC3N(37–36). All of these lines reveal a kinematical pattern very similar to the one in Fig. 4a, demonstrating that such a pattern does not depend on the tracer and mirrors a real physical structure. In Fig. 4b we show an overlay of the velocity peaks of all the lines and a velocity map of the best-fit model. Clearly, the agreement between the computed and observed LSR velocities is remarkable. The best-fit parameters are the following: Vsys =30.0 ± 0.3 km s-1,
  ,
,  , ψ = 157 ± 4°, θ = 19 ± 1°, and M ∗ = 18 ± 3 M⊙.
A lower limit for the disk radius is Rdisk ≃ 2500 AU, obtained from the maximum deprojected distance of the peaks from the center. One may wonder if such a big structure can undergo Keplerian rotation. The mass of the disk can be estimated from the continuum emission. The integrated flux density from core B at 350 GHz is 0.32 Jy. Assuming a dust absorption coefficient 0.5 cm2 g-1 (ν/230.6 GHz) (Kramer et al. 2003) and a gas-to-dust mass ratio of 100, we obtain ~3 M⊙ for a dust temperature of 100 K. Despite the large uncertainties on the dust opacity and temperature, we believe that the mass of core B is significantly less than the central mass (~18 M⊙), which satisfies the condition for Keplerian rotation.
It is worth stressing that our findings are in good agreement with the recent study by Ilee et al. (2012). Through measurements of scattered light from G35.20–0.74 N, these authors find that the CO first overtone bandhead emission at 2.3 μm can be fitted with a Keplerian disk rotating about a 17.7 M⊙ star.
The distribution of the molecular peaks in Fig. 4b clearly shows that our observations detect only the NE side of the disk. We speculate that this could be an opacity effect. If the disk is optically thick in the relevant lines, flared, and inclined by 19°, only part of the surface heated by the star is visible to the observer. This creates an asymmetry along the direction of the projected disk axis, with line emission being more prominent on the side (in our case the NE side) where the disk surface is visible. Clearly, radiative transfer calculations are needed to confirm this scenario, but we note that in our source the NE part of the disk axis should be pointing towards the observer, consistent with the orientation of the CO outflow (blue-shifted to the NE and red-shifted to the SW – see GHLW) and the obscuration seen to the SW in the IR images (see Fig. 2).
4. The stellar content of core B: A binary system?
An issue that is worth discussing is whether an 18 M⊙ YSO is compatible with the bolometric luminosity of the region. (3 × 10⁴ L⊙; see Sect. 1). Depending on the adopted mass–luminosity relation, the luminosity expected for an 18 M⊙ star ranges from 2.5 × 10⁴ L⊙ (Diaz-Miller et al. 1998), to 6.6 × 10⁴ L⊙ (Martins et al. 2005). This means that the 18 M⊙ star should be the main contributor to the luminosity of the whole star forming region. Such a possibility seems quite unlikely due to the presence of multiple cores (see Fig. 2), one of which is an HMC possibly hosting at least another high-mass star (core A).
A possibility is that one is underestimating the true luminosity due to the “flashlight effect”, where part of the stellar photons are lost through the outflow cavities. According to the recent model by Zhang et al. (2013), when this effect is taken into account, the luminosity obtained assuming isotropic emission (3.3 × 10⁴ L⊙) becomes as high as 7 × 10⁴–2.2 × 10⁵ L⊙, consistent with a single star of ~20–34 M⊙.
While the previous explanation is possible, the isotropic estimate appears more robust than a model-dependent value, and we thus consider another hypothesis, namely that one is dealing with a binary system. In this case, the luminosity is significantly reduced with respect to that of a single 18 M⊙ object and may be as low as ~7 × 10³ L⊙ for equal members. The latter is much less than the bolometric luminosity, thus allowing for a significant contribution by other YSOs.
The existence of a binary system could also explain why the N–S jet associated with core B is not aligned with the disk rotation axis. The presence of a companion would in fact be sufficient to induce precession of the jet/outflow, as hypothesized by Shepherd et al. (2000) to explain the observed precession of the bipolar outflow from the high-mass protostar IRAS 20126+4104. In this scenario, the outflow from core B would precess about an axis oriented NE–SW, i.e. along the bisector of the butterfly-shaped IR nebula seen in Fig. 1. The IR emission would arise from the cavity opened by the outflow itself during its precession, while the thermal radio jet would trace the current direction of the precessing axis.
The last question we address is the origin of the free-free emission from core B (see e.g. Fig. 3). Could this be tracing a (hypercompact) Hii region? According to GHLW, this source (N. 7 in their Table 1) has a spectral index >1.3 between 6 and 3.6 cm, compatible with free-free emission from an optically thick Hii region. Extrapolation of the 3.6 cm flux density (0.5 mJy) to 1.3 cm gives >1.9 mJy, in agreement with the 3 mJy flux measured, with lower angular resolution, by Codella et al. (2010). It is thus possible that the emission is partially thick at 1.3 cm, and the Lyman continuum estimate of 1045 s-1 obtained under the optically thin assumption is a lower limit. A binary system with a total mass of 18 M⊙ has a Lyman continuum flux (see Diaz-Miller et al. 1998) ranging from 5 × 1044 s-1 (for equal masses) to 1.8 × 1047 s-1. We conclude that we could be observing an Hii region ionized by a binary system at the center of a Keplerian disk. Should this be confirmed, G35.20–0.74 N would represent a unique example of radio jet coexisting with an Hii region powered by the same YSO(s). Investigating such a short-lived transition phase in the evolution of an OB-type star could provide us with important clues to the formation process of these objects.
Estimate taken from the rms database, available at http://www.ast.leeds.ac.uk/cgi-bin/RMS/RMS_DATABASE.cgi
Acknowledgments
It is a pleasure to thank Göran Sandell for stimulating discussions of the G35.20–0.74 N region and the anonymous referee for constructive criticisms. We also acknowledge the support of the European ALMA Regional Center and the Italian ARC node. This paper makes use of the following ALMA data: ADS/JAO.ALMA#2011.0.00275.S. ALMA is a partnership of ESO (representing its member states), NSF (USA), and NINS (Japan), together with NRC (Canada) and NSC and ASIAA (Taiwan), in cooperation with the Republic of Chile. The Joint ALMA Observatory is operated by ESO, AUI/NRAO, and NAOJ. This work also used observations made with the Spitzer Space Telescope, which is operated by the Jet Propulsion Laboratory, California Institute of Technology, under a contract with NASA. MSNK is supported by a Ciência 2007 contract, funded by FCT (Portugal) and POPH/FSE (EC).
References
- Benjamin, R. A., Churchwell, E., Babler, B. L., et al. 2003, PASP, 115, 953 [NASA ADS] [CrossRef] [Google Scholar]
- Birks, J. R., Fuller, G. A., & Gibb, A. G. 2006, A&A, 458, 181 (BFG) [NASA ADS] [CrossRef] [EDP Sciences] [Google Scholar]
- Bonnell, I. A., & Bate, M. R. 2006, MNRAS, 370, 488 [NASA ADS] [CrossRef] [Google Scholar]
- Brebner, G. C., Heaton, B., Cohen, R. J., & Davies, S. R. 1987, MNRAS, 229, 679 [NASA ADS] [CrossRef] [Google Scholar]
- Cesaroni, R., Galli, D., Lodato, G., Walmsley, C. M., & Zhang, Q. 2007, in Protostars and Planets V, eds. B. Reipurth, D. Jewitt, & K. Keil (Tucson: Univ. of Arizona Press), 197 [Google Scholar]
- Codella, C., Cesaroni, R., López-Sepulcre, A., et al. 2010, A&A, 510, A86 [NASA ADS] [CrossRef] [EDP Sciences] [Google Scholar]
- De Buizer, J. M. 2006, ApJ, 642, L57 [NASA ADS] [CrossRef] [Google Scholar]
- Dent, W. R. F., Little, L. T., Kaifu, N., Ohishi, M., & Suzuki, S. 1985, A&A, 146, 375 [NASA ADS] [Google Scholar]
- Dent, W. R. F., Little, L. T., Sato, S., Ohishi, M., & Yamashita, T. 1985, MNRAS, 217, 217 [NASA ADS] [CrossRef] [Google Scholar]
- Diaz-Miller, R. I., Franco, J., & Shore, S. N. 1998, ApJ, 501, 192 [NASA ADS] [CrossRef] [Google Scholar]
- Dutrey, A., Guilloteau, S., & Ho, P. 2007, in Protostars and Planets V, eds. B. Reipurth, D. Jewitt, & K. Keil (Tucson: Univ. of Arizona Press), 495 [Google Scholar]
- Estalella, R., Mauersberger, R., Torrelles, J. M., et al. 1993, ApJ, 419, 698 [NASA ADS] [CrossRef] [Google Scholar]
- Fuller, G. A., Zijlstra, A. A., & Williams, S. J. 2001, ApJ, 555, L125 [NASA ADS] [CrossRef] [Google Scholar]
- Gibb, A. G., Hoare, M. G., Little, L. T., & Wright, M. C. H. 2003, MNRAS, 339, 1011 (GHLW) [NASA ADS] [CrossRef] [Google Scholar]
- Heaton, B. D., & Little, L. T. 1988, A&A, 195, 193 [NASA ADS] [Google Scholar]
- Ilee, J. D., Wheelwright, H. E., Oudmaijer, R. D., et al. 2013, MNRAS, 429, 2960 [NASA ADS] [CrossRef] [Google Scholar]
- Keto, E. 2007, ApJ, 666, 976 [NASA ADS] [CrossRef] [Google Scholar]
- Kramer, C., Richer, J., Mookerjea, B., Alves, J., & Lada, C. 2003, A&A, 399, 1073 [NASA ADS] [CrossRef] [EDP Sciences] [Google Scholar]
- Krumholz, M. R., Klein, R. I., McKee, C. F., Offner, S. S. R., & Cunningham, A. J. 2009, Science, 323, 754 [NASA ADS] [CrossRef] [PubMed] [Google Scholar]
- Lee, H.-T., Takami, M., Duan, H.-Y., et al. 2012, ApJS, 200, 2 [NASA ADS] [CrossRef] [Google Scholar]
- Little, L. T., Dent, W. R. F., Heaton, B., Davies, S. R., & White, G. J. 1985, MNRAS, 217, 227 [NASA ADS] [CrossRef] [Google Scholar]
- Little, L. T., Kelly, M. L., & Murphy, B. T. 1998, MNRAS, 294, 105 [NASA ADS] [CrossRef] [Google Scholar]
- López-Sepulcre, A., Codella, C., Cesaroni, R., Marcelino, N., & Walmsley, C. M. 2009, A&A, 499, 811 [NASA ADS] [CrossRef] [EDP Sciences] [Google Scholar]
- Martins, F., Schaerer, D., & Hillier, D. J. 2005, A&A, 436, 1049 [NASA ADS] [CrossRef] [EDP Sciences] [Google Scholar]
- Shepherd, D. S., Yu, K. C., Bally, J., & Testi, L. 2000, ApJ, 535, 833 [Google Scholar]
- Velusamy, T., Marsh, K. A., Beichman, C. A., Backus, C. R., & Thompson, T. J. 2008, AJ, 136, 197 [NASA ADS] [CrossRef] [Google Scholar]
- Walther, D. M., Aspin, C., & McLean, I. S. 1990, ApJ, 356, 544 [NASA ADS] [CrossRef] [Google Scholar]
- Wang, K.-S., van der Tak, F. F. S., & Hogerheijde, M. R. 2012, A&A, 543, A22 [NASA ADS] [CrossRef] [EDP Sciences] [Google Scholar]
- Zhang, Q., Hunter, T. R., Beuther, H., et al. 2007, ApJ, 658, 1152 [NASA ADS] [CrossRef] [Google Scholar]
- Zhang, B., Zheng, X. W., Reid, M. J., et al. 2009, ApJ, 693, 419 [NASA ADS] [CrossRef] [Google Scholar]
- Zhang, Y., Tan, J. C., De Buizer, J. M., et al. 2013, ApJ, in press [arXiv:1302.38582] [Google Scholar]
- Zinnecker, H., & Yorke, H. W. 2007, ARA&A, 45, 481 [NASA ADS] [CrossRef] [Google Scholar]
All Figures
|
Fig. 1 Large-scale image of the 4.5 μm emission towards the star-forming region G35.20–0.74 N overlaid with a contour map of the 350 GHz continuum emission obtained with ALMA. The IR image has been obtained by applying HiRes deconvolution (Velusamy et al. 2008) to the Spitzer/IRAC data. The sub-mm map has been corrected for primary beam attenuation. The contours range from 9 to 203 mJy/beam in steps of 10.8 mJy/beam. The dashed circle denotes the primary beam of the ALMA 12-m antennas. The ellipse in the bottom right is the ALMA synthesized beam. |
| In the text | |
|
Fig. 2 Same as Fig. 1, with the 3.6 cm continuum map by GHLW overlaid (magenta contours). Unlike Fig. 1, the 4.5 μm image is displayed using linear scaling to emphasize the brightest structures outlining the N–S jet. Cores A, B, and G35MM2 are indicated by the arrows. |
| In the text | |
|
Fig. 3 Overlay of the average emission in the CH3CN(19–18) K = 2 line (white contours) and 3.6 cm free-free continuum emission (red contours; from GHLW) on a map of the first moment (i.e. velocity) of the same CH3CN line. The velocity intervals used to calculate the mean emission and first moment are 25.9−38.0 km s-1 for core A and 25.9−33.0 km s-1 for core B. The dashed line is intended to stress that different color scales are used for the two cores to emphasize the velocity gradients. The white contour levels range from 80 to 656 mJy/beam in steps of 96 mJy/beam. The crosses mark the positions of the 350 GHz continuum peaks. The ellipse in the bottom right indicates the synthesized beam. |
| In the text | |
|
Fig. 4 a) Peaks of the CH3CN(19–18) K = 2 line emission (solid circles) obtained with a 2D Gaussian fit channel by channel. For each peak the corresponding 50% contour level is also drawn (using the same color as the peak). The color corresponds to the line-of-sight velocity, according to the scale displayed to the right. The ellipse in the bottom right denotes the synthesized beam. b) Comparison between the velocity of the best-fit Keplerian disk (color map) and the emission peaks at different velocities (solid circles) obtained for the following lines: CH3CN(19–18) K = 2,3,4, CH3OH(71,6–61,5) vt = 1, CH3OH(141,13–140,14), and HC3N(37–36). The crosses mark the position of the continuum peak. |
| In the text | |
Current usage metrics show cumulative count of Article Views (full-text article views including HTML views, PDF and ePub downloads, according to the available data) and Abstracts Views on Vision4Press platform.
Data correspond to usage on the plateform after 2015. The current usage metrics is available 48-96 hours after online publication and is updated daily on week days.
Initial download of the metrics may take a while.