Fig. 7
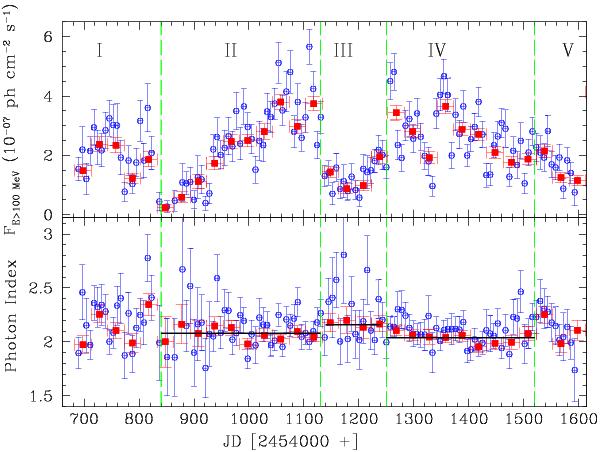
Gamma-ray flux and photon index light curve of S5 0716+714 measured with the Fermi/LAT for a time period between August 04, 2008 to February 07, 2011. The blue symbols show the weekly averaged flux while monthly averaged values are plotted in red. Different activity states of the source are separated by vertical green lines. A marginal softening of spectrum over the quiescent state can be seen here.
Current usage metrics show cumulative count of Article Views (full-text article views including HTML views, PDF and ePub downloads, according to the available data) and Abstracts Views on Vision4Press platform.
Data correspond to usage on the plateform after 2015. The current usage metrics is available 48-96 hours after online publication and is updated daily on week days.
Initial download of the metrics may take a while.