Fig. 6
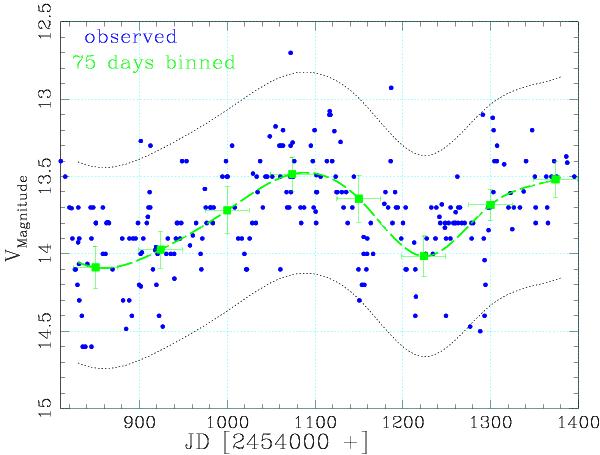
Optical V passband light curve of S5 0716+714 with different time binning. The light curve appears as a superposition of fast flares on a modulated base level varying on a (350 ± 9) day timescale. These slower variations can be clearly seen in 75-day binned light curve (error bar represents variations in flux over the binned period). The dashed line represents a spline interpolation through the 75-day binned light curve. Dotted lines are obtained by shifting the spline by ±0.65 mag.
Current usage metrics show cumulative count of Article Views (full-text article views including HTML views, PDF and ePub downloads, according to the available data) and Abstracts Views on Vision4Press platform.
Data correspond to usage on the plateform after 2015. The current usage metrics is available 48-96 hours after online publication and is updated daily on week days.
Initial download of the metrics may take a while.