Fig. 2
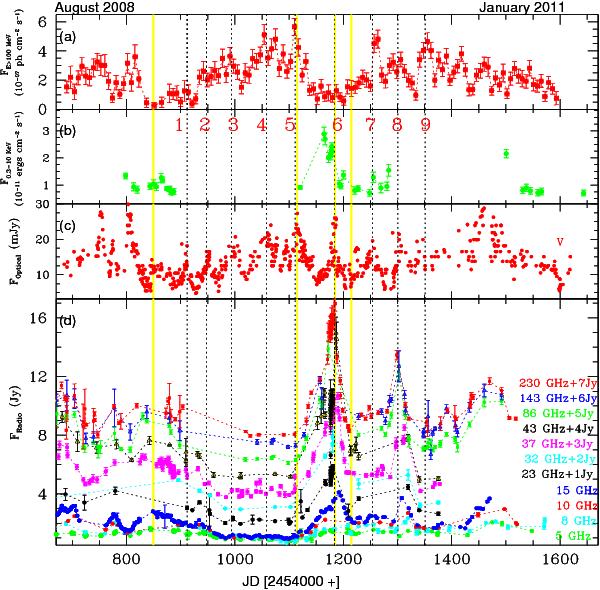
Light curves of 0716+714 from γ-ray to radio wavelengths a) GeV light curve at E > 100 MeV; b) X-ray light curve at 0.3−10 KeV; c) optical V passband light curve and d) 5 to 230 GHz radio light curves. Vertical dotted lines are marked w.r.t. different optical flares labeling the broadband flares as “G” for γ-rays, “X” for X-rays, “O” for optical and “R” for Radio followed by the number close to flare. The yellow area represents the period for which we construct the broadband SEDs of the source (see Sect. 3.5 for details).
Current usage metrics show cumulative count of Article Views (full-text article views including HTML views, PDF and ePub downloads, according to the available data) and Abstracts Views on Vision4Press platform.
Data correspond to usage on the plateform after 2015. The current usage metrics is available 48-96 hours after online publication and is updated daily on week days.
Initial download of the metrics may take a while.