Fig. 19
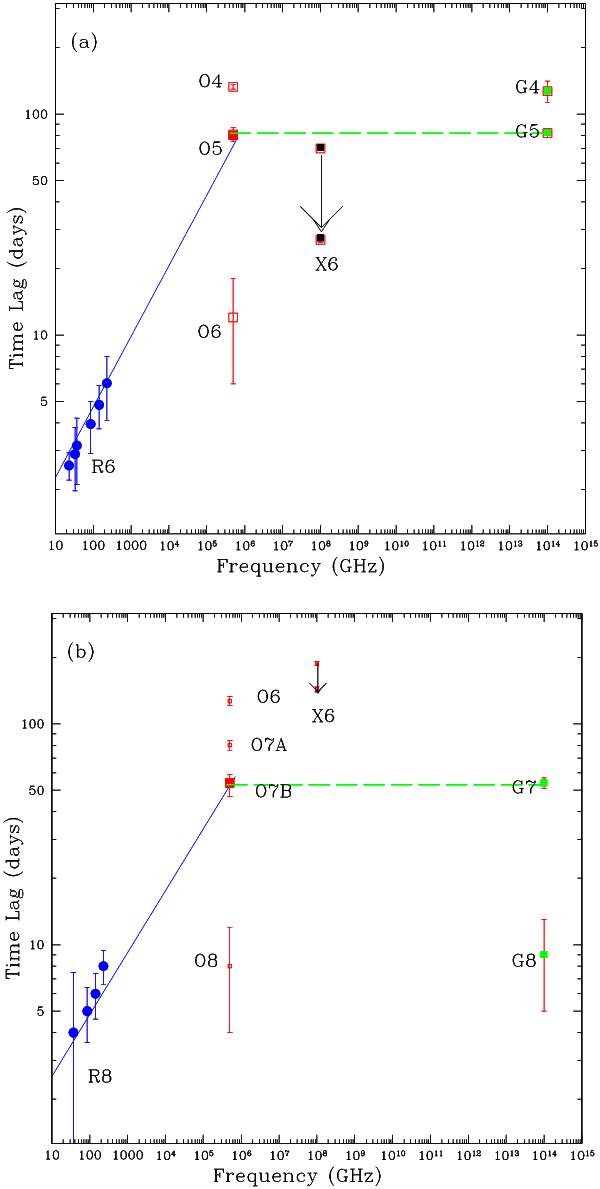
a) Time lag measurements vs. frequency using 15 GHz as the reference frequency for the radio flare R6. The best fitted power law at radio and mm frequencies is extended up to the optical wavelengths. The near by optical, X-ray and GeV flares are shown with their possible time lags w.r.t. R6. b) The same for the R8 flare (see Fig. 2 for flare labeling) In both plots, the dashed lines indicate the SSC process with simultaneous optical-γ-ray events.
Current usage metrics show cumulative count of Article Views (full-text article views including HTML views, PDF and ePub downloads, according to the available data) and Abstracts Views on Vision4Press platform.
Data correspond to usage on the plateform after 2015. The current usage metrics is available 48-96 hours after online publication and is updated daily on week days.
Initial download of the metrics may take a while.