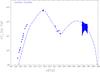
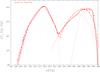
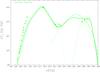
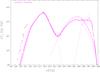
Fig. 18
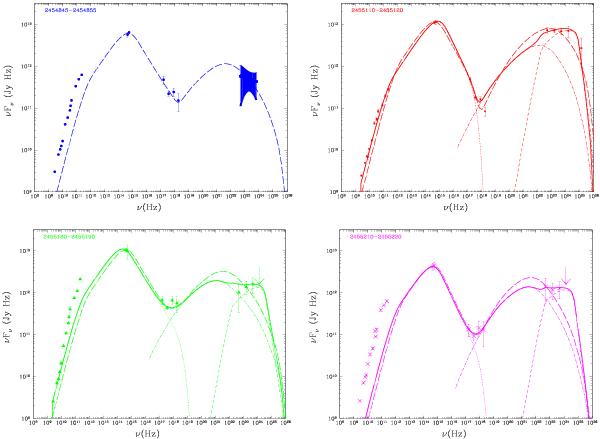
Broad band SEDs of S5 0716+714. Each SED is constructed using 10-day averaged multifrequency data. The error bars represent the variation of flux over 10 days in each bin. Pure SSC models are shown as thick dashed curves. For EC fits, the total model SEDs are the thick solid curves; the synchrotron components are dotted, the SSC components are dot-dashed, and the EC components are thin dashed curves.
Current usage metrics show cumulative count of Article Views (full-text article views including HTML views, PDF and ePub downloads, according to the available data) and Abstracts Views on Vision4Press platform.
Data correspond to usage on the plateform after 2015. The current usage metrics is available 48-96 hours after online publication and is updated daily on week days.
Initial download of the metrics may take a while.