Free Access
Fig. 17
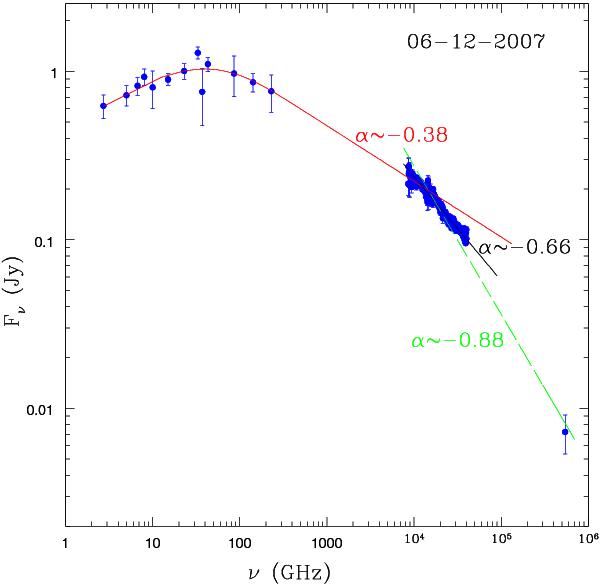
Radio-IR spectra using Spitzer observations. The red curve is the best fitted synchrotron self-absorbed spectra with a break at (1.3 ± 0.1) × 104 GHz with a spectral break Δα = 0.28 ± 0.1. The green line represents the spectral fitting including optical data point and this leads to spectral break Δα = 0.51 ± 0.09.
Current usage metrics show cumulative count of Article Views (full-text article views including HTML views, PDF and ePub downloads, according to the available data) and Abstracts Views on Vision4Press platform.
Data correspond to usage on the plateform after 2015. The current usage metrics is available 48-96 hours after online publication and is updated daily on week days.
Initial download of the metrics may take a while.