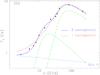
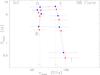
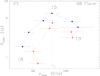
Fig. 16
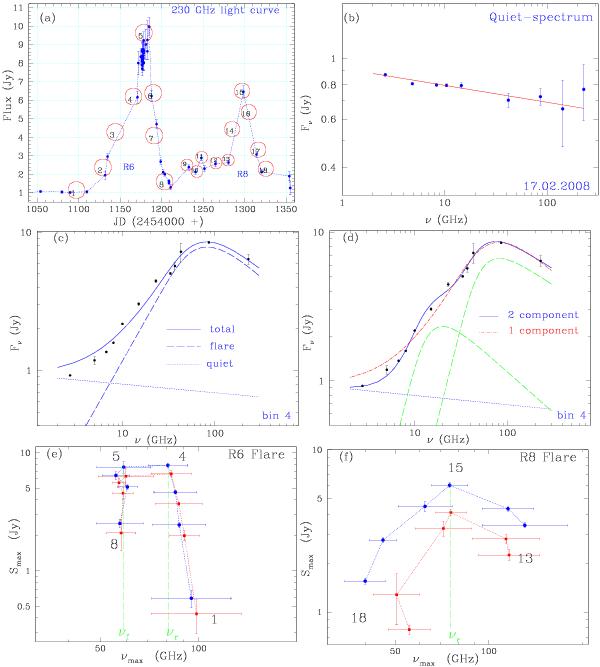
Evolution of the radio spectra: a) 230 GHz light curve showing different periods over which the spectra are constructed. b) Quiescent radio spectrum; c) results of a single component spectral fitting at time bin “4”, the dotted line corresponds to the quiescent spectrum, the dashed one to the flaring spectrum and the solid line to the total spectrum. d) The same spectrum fitted by a two-component synchrotron self-absorbed model, with the green dashed line showing the individual components and the blue solid line showing a combination of the two. A single component model curve is displayed with a dotted-dashed red curve for comparison. e) and f) The time evolution of Smax vs. νmax for the R6 and R8 radio flares. The spectral evolution extracted using a single-component model is shown by blue symbols and the red symbols denote a two-component model (see text for details).
Current usage metrics show cumulative count of Article Views (full-text article views including HTML views, PDF and ePub downloads, according to the available data) and Abstracts Views on Vision4Press platform.
Data correspond to usage on the plateform after 2015. The current usage metrics is available 48-96 hours after online publication and is updated daily on week days.
Initial download of the metrics may take a while.