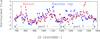
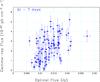
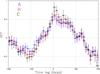
Fig. 13
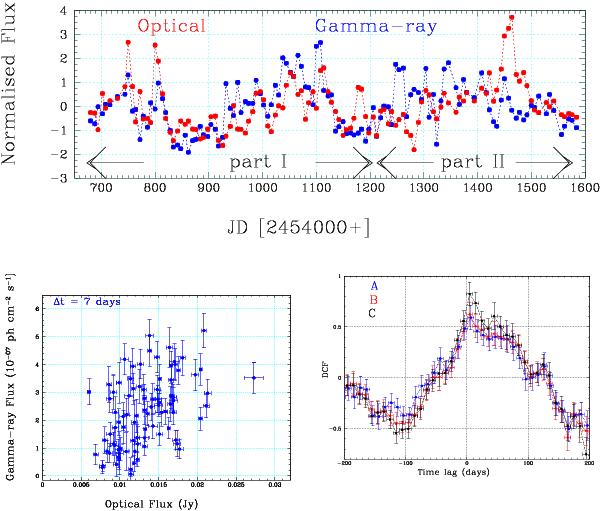
Top: weekly averaged normalized flux at γ-ray and optical V band frequencies plotted vs. time. The flux variations at these two frequencies seem to have a one-to-one correlation with each other. Bottom left: γ-ray vs. optical flux. Bottom right: the DCF curve of γ-ray vs. optical V passband flux using a bin size of 10-day in each case. A: using the complete data as shown in Fig. 2; B: after removing the data covering the duration of the optical flare O6; C: using the data before flare O6.
Current usage metrics show cumulative count of Article Views (full-text article views including HTML views, PDF and ePub downloads, according to the available data) and Abstracts Views on Vision4Press platform.
Data correspond to usage on the plateform after 2015. The current usage metrics is available 48-96 hours after online publication and is updated daily on week days.
Initial download of the metrics may take a while.