Free Access
Fig. 1
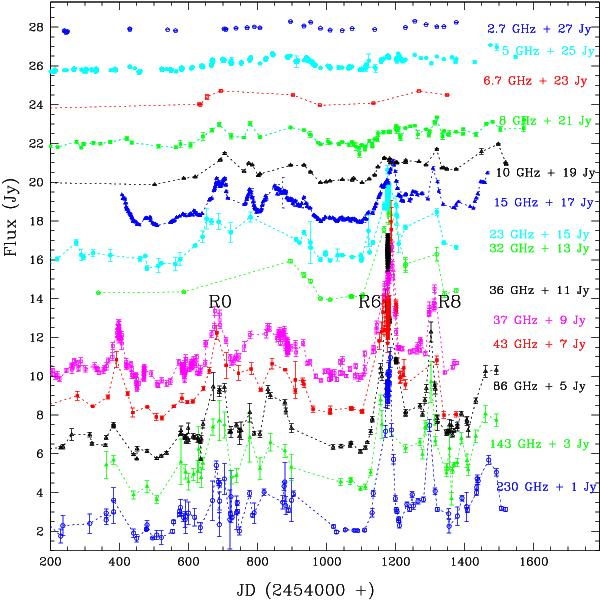
Radio to mm wavelength light curves of S5 0716+714 observed over the past ~3 years. For clarity, the light curves at different frequencies are shown with arbitrary offsets (indicated by a “Frequency + x Jy” label). The major radio flares are labeled as “R0”, “R6” and “R8” (see Fig. 2 for the details of labeling).
Current usage metrics show cumulative count of Article Views (full-text article views including HTML views, PDF and ePub downloads, according to the available data) and Abstracts Views on Vision4Press platform.
Data correspond to usage on the plateform after 2015. The current usage metrics is available 48-96 hours after online publication and is updated daily on week days.
Initial download of the metrics may take a while.