Fig. 7
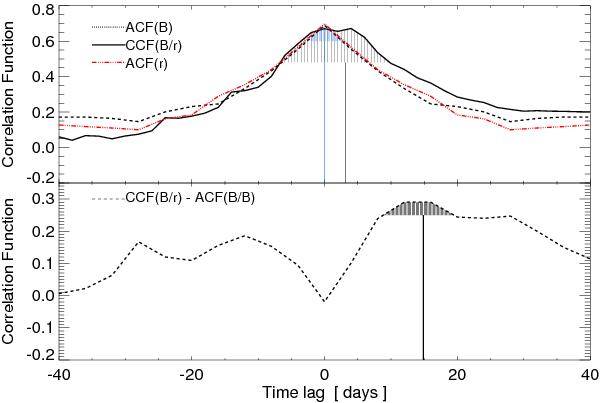
Broad-band RM results. Top: the B-band ACF (dotted line) show a well defined centroid at zero lag (vertical blue line), while the B/r-band CCF shows the same peak at zero lag, a secondary peak at 3 days is also visible (vertical black line). In the same case as the B-band ACF, the r-band ACF (red line) show a peak at zero lag, however, one additionally faint peak is clearly visible between 10–20 days, in comparison with the ACF of the B-band. Bottom: the cross-correlation yields a centroid lag of 15.0 days (vertical black line). The red shaded area marks the range used to calculate the centroid.
Current usage metrics show cumulative count of Article Views (full-text article views including HTML views, PDF and ePub downloads, according to the available data) and Abstracts Views on Vision4Press platform.
Data correspond to usage on the plateform after 2015. The current usage metrics is available 48-96 hours after online publication and is updated daily on week days.
Initial download of the metrics may take a while.