Fig. 6
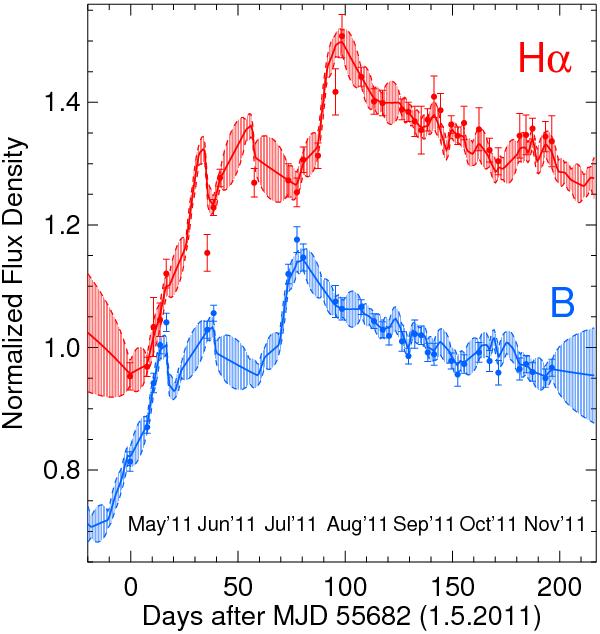
Synthetic Hα and continuum light curves. The solid red and blue lines show the Hα and continuum models estimated by SPEAR respectively. The red and blue area (enclosed by the dashed line) represent the expected variance about the mean light curve model. The original Hα light curve is computed by subtracting a scaled r curve from the SII curve and re-normalizing it to mean = 1 (red dots). The Hα light curve is vertically shifted by 0.2 with respect to the continuum light curve (blue dots) for clarity.
Current usage metrics show cumulative count of Article Views (full-text article views including HTML views, PDF and ePub downloads, according to the available data) and Abstracts Views on Vision4Press platform.
Data correspond to usage on the plateform after 2015. The current usage metrics is available 48-96 hours after online publication and is updated daily on week days.
Initial download of the metrics may take a while.