Free Access
Fig. 4
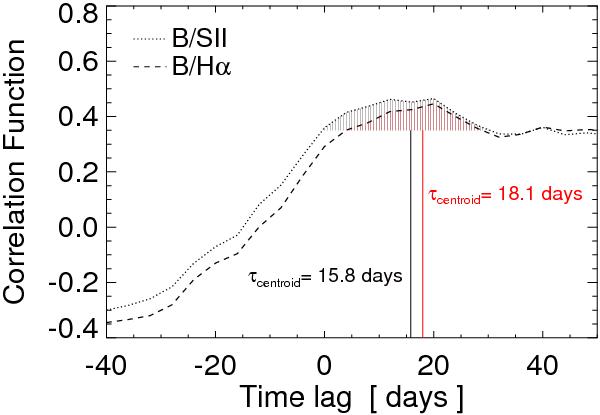
Cross correlation of B and SII light curves (dotted line) and of B and Hα light curves (dashed line). The error range (± 1σ) around the cross correlation was omitted for better viewing. The red and black shaded areas marks the range used to calculate the centroid of the lag (vertical red and black straight lines).
Current usage metrics show cumulative count of Article Views (full-text article views including HTML views, PDF and ePub downloads, according to the available data) and Abstracts Views on Vision4Press platform.
Data correspond to usage on the plateform after 2015. The current usage metrics is available 48-96 hours after online publication and is updated daily on week days.
Initial download of the metrics may take a while.