Free Access
Fig. 3
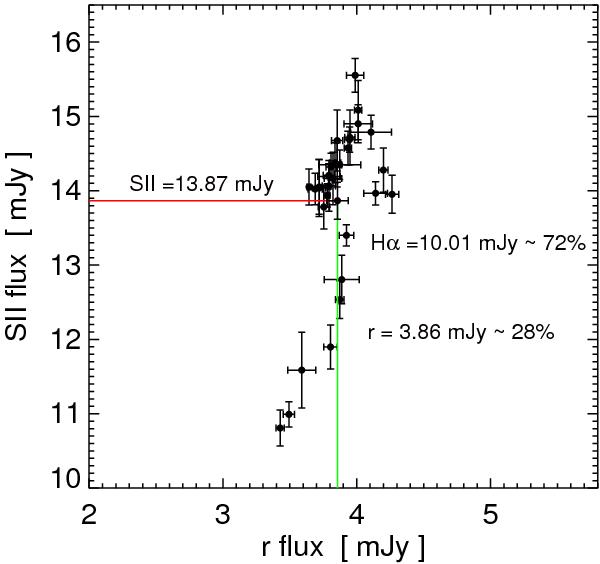
Flux-flux diagram for the SII and r band measured using 7.5′′ aperture. Black dots denote the measurement pair of each night. The straight red and green lines represents the average flux in the SII and r band respectively. The data are as observed and not corrected for galactic foreground extinction.
Current usage metrics show cumulative count of Article Views (full-text article views including HTML views, PDF and ePub downloads, according to the available data) and Abstracts Views on Vision4Press platform.
Data correspond to usage on the plateform after 2015. The current usage metrics is available 48-96 hours after online publication and is updated daily on week days.
Initial download of the metrics may take a while.