| Issue |
A&A
Volume 552, April 2013
|
|
|---|---|---|
| Article Number | A43 | |
| Number of page(s) | 5 | |
| Section | Extragalactic astronomy | |
| DOI | https://doi.org/10.1051/0004-6361/201221006 | |
| Published online | 21 March 2013 | |
Research Note
The Canada-France High-z Quasar Survey: 1.2 mm observations
1
UPMC Univ Paris 06, UMR 7095, Institut d’Astrophysique de
Paris,
75014
Paris,
France
e-mail:
This email address is being protected from spambots. You need JavaScript enabled to view it.
2
CNRS, UMR 7095, Institut d’Astrophysique de Paris,
75014
Paris,
France
3
Herzberg Institute of Astrophysics, National Research Council, 5071 West Saanich Rd,
Victoria, BC
V9E 2E7,
Canada
4
Univ Paris-Sud and CNRS, Institut d’Astrophysique Spatiale, UMR
8617, 91405
Orsay,
France
5
Astronomy DepartmentUniversidad de Concepción,
Casilla 160- C Concepción, Chile
6
UJF-Grenoble 1/CNRS-INSU, Institut de Planétologie et
d’Astrophysique de Grenoble (IPAG) UMR 5274, 38041
Grenoble,
France
Received: 25 December 2012
Accepted: 27 January 2013
Abstract
We report 250 GHz (1.2 mm) observations of a sample of 20 quasars at redshifts 5.8 < z < 6.5 from the Canada-France High-z Quasar Survey (CFHQS), using the Max-Planck-Millimeter-Bolometer (MAMBO) array at the 30-metre telescope of the Institut de Radioastronomie Millmétrique (IRAM). An rms sensitivity of ≲0.6 mJy was achieved for 65% of the sample, and of ≲1.0 mJy for 90%. Only one quasar, CFHQS J142952+544717, was robustly detected with S250 GHz = 3.46 ± 0.52 mJy. This indicates that one of the most powerful known starbursts at z ~ 6 is associated with this radio-loud quasar. On average, the other CFHQS quasars, which have a mean optical magnitude fainter than the previously studied samples of z ~ 6 quasars of the Sloan Digital Sky Survey (SDSS), have a mean 1.2 mm flux density ⟨ S250 GHz ⟩ = 0.41 ± 0.14 mJy; this average detection with a signal-to-noise (S/N) ratio of 2.9 is hardly meaningful. It would correspond to ⟨ LFIR ⟩ ≈ 0.94 ± 0.32 × 10¹² L⊙, and an average star formation rate of a few 100 M⊙/yr, depending on the stellar initial mass function (IMF) and a possible contribution of an active galactic nucleus (AGN) to ⟨ LFIR ⟩. This is consistent with previous findings of Wang et al. on the far-infrared emission of z ~ 6 quasars and extends their results toward optically fainter sources.
Key words: galaxies: high-redshift / galaxies: starburst / galaxies: active / infrared: galaxies / submillimeter: galaxies
© ESO, 2013
1. Introduction
The highest-redshift quasars which are known at z ≳ 6 are fascinating objects that provide crucial clues about the growth of supermassive black holes (SMBH), their host galaxies, and their environment toward the end of the reionization epoch when the Universe was less than 1 Gyr old. Black holes of several 109 M⊙ were already in place (Willott et al. 2003; Kurk et al. 2007; Jiang et al. 2007; Mortlock et al. 2012). Such a rapid growth of the mass of early black holes puts extremely severe constraints on classical Eddington accretion limited by radiation pressure. It might point to the existence of a more efficient process for forming a massive black hole such as direct collapse without fragmenting (Begelman et al. 2006; Volonteri 2012).
Optical data and results of 1.2 mm observations of full CFHQS sample.
In this context, it is obviously critical to accumulate more information about SMBH growth and the parallel formation of the first massive galaxies in the most massive dark matter halos at the reionization epoch. An important point to clarify is the black-hole-to-galaxy mass ratio at this epoch, and to see how it compares to the current value at z = 0. A related piece of information is provided by the relationship between the galaxy growth by star formation and the quasar luminosity generated in black hole accretion. Both processes result mainly from gas transport to the center of the galaxy. They should contribute in building the final tight relation between the masses of the black hole and the galaxy, even if this relation is mainly ruled by quasar feedback onto the interstellar gas.
As the emission of young stars is mostly channeled into the far-infrared (FIR) by dust in such massive starburst galaxies, the FIR luminosity, LFIR, directly reflects the star formation rate (SFR). In the absence of multi-wavelength sampling of the FIR emission, one may assume a standard infrared spectral energy distribution (SED) (e.g., Wang et al. 2008), and thus directly derive LFIR and SFR from the measurement of the continuum flux density at a single wavelength. At z ≳ 6, a single continuum observation in the λ ~ 1 mm window efficiently probes the bulk of the rest-frame FIR emission and thus provides a simple estimate of LFIR and SFR. In addition, these ~1 mm observations yield valuable estimates of the dust mass in the host galaxy which reflects a combination of the gas mass and the metallicity.
After a series of such mm/submm studies of FIR properties of z ~ 2−4 quasars (e.g., Omont et al. 2001, 2003; Carilli et al. 2001; Priddey et al. 2003), this method was successfully applied by Wang et al. (2008, 2011a) to investigate the FIR properties, inferred from 1.2 mm observations, of 40 z ~ 6 quasars mainly discovered from the Sloan Digital Sky Survey (SDSS, Fan et al. 2006). A significant percentage (30%) of the Wang et al. z ~ 6 sample is detected at 1.2 mm, pointing to an excess of FIR emission dominated by a strong starburst with a star formation rate ≈500−1000 M⊙/yr. At the sensitivity of these studies, ~1−1.5 mJy at 1.2 mm, 70% of the quasars are not detected, and for the whole sample the behavior of the FIR luminosity with respect to the bolometric luminosity Lbol is similar to that of all quasars at any redshift, pointing to an important contribution of the active galactic nuclei (AGN) to the FIR emission.
Besides SDSS, the Canada-France High-z Quasar Survey (CFHQS) is the second largest provider of z ~ 6 quasars. With 20 sources it accounts for about one third of the total number of quasars at 5.7 < z < 6.5. Coming from deeper optical surveys, the CFHQS sample contains quasars optically much fainter than both the main SDSS sample and the SDSS deep southern survey. The purpose of this Note is to publish the results of the 1.2 mm survey of the 20 z ~ 6 CFHQS quasars that we performed to extend the existing studies of FIR properties of quasars at similar redshifts to optically fainter sources. For four of these sources, 1.2 mm results were already published in Willott et al. (2007). The exceptionally strong 1.2 mm flux density that we found for CFHQS J1429+5447 led to the selection of this source to search for CO(2−1) emission (Wang et al. 2011b). Together with those of Wang et al. (2011a), our results provide a useful background for the much deeper studies of submillimeter properties of optically faint z ~ 6 quasars that we have already begun with The Atacama Large Millimeter/submillimeter Array (ALMA, Willott et al. 2013).
Cosmological parameters of H0 = 70 km s-1 Mpc-1, ΩM = 0.28 and ΩΛ = 0.72 (Komatsu et al. 2009) are assumed throughout.
2. Observations
The CFHQS is an optically-selected survey for 5.8 < z < 6.5 quasars. It was carried out in regions of the sky observed as part of the Canada-France-Hawaii Telescope Legacy Survey1, the Subaru/XMM-Newton Deep Survey and the Red-sequence Cluster Survey 2. With  -band magnitude survey limits ranging from
  to
to  in different regions of the sky, CFHQS quasars are typically 10−100 times lower in luminosity than quasars at the same redshift from the main SDSS sample (Fan et al. 2006), and many are less luminous than those from the SDSS Deep Stripe (Jiang et al. 2008, 2009). The CFHQS survey contains 20 spectroscopically-confirmed quasars at 5.88 < z < 6.43, a significant percentage of the total of ≈60 quasars known at this epoch (Willott et al. 2007, 2009, 2010a,b). Table 1 contains the positions, redshifts, magnitudes, absolute magnitudes and bolometric luminosities of the full sample. Bolometric luminosities have been determined from the absolute magnitudes at 1450 Å assuming a bolometric conversion factor ζ1450A = Lbol/(νLν,1450A) of 4.4 (Richards et al. 2006).
The millimeter observations were performed within the pool observing sessions at the IRAM 30 m telescope in the winters of 2007 through 2010 using the 117-element version of the Max Planck Millimeter Bolometer (MAMBO) array (Kreysa et al. 1998) operating at an average wavelength of 1.2 mm (250 GHz). We used the standard on-off photometry observing mode, chopping between the target and sky by 32′′ in azimuth at 2 Hz every 10 s, and nodding the telescope every 10 or 20 s (see e.g., Wang et al. 2011a). On average, the noise of the channel used for point-source observations was about 35−40 mJy /beam. This allowed us to achieve rms ≲0.5−1.0 mJy for 18 of the 20 sources, with 0.5−1.5 hr of telescope time per source. Unfortunately, poor weather conditions during the last observing runs prevented us from reaching the aimed rms of ~0.6 mJy for 8 sources out of 20. The data were reduced with standard procedures to minimize the sky noise with the package developed by Zylka (1998).
Average properties.
The results are shown in Table 1. Only the peculiar source CFHQS J1429+5447 is detected with a signal-to-noise ratio S/N > 5. Two other sources, CFHQS J0033-0125 (Willott et al. 2007) and CFHQS J0102-0218, are marginally detected with S/N = 3.1 and 2.7, respectively, thanks to special deeper observations that bring the rms below 0.4 mJy. There are ten other sources with rms between 0.45 and 0.65 mJy, and five between 0.75 and 1.0 mJy, all with S/N < 2.
This 3σ detection rate of barely 10% is significantly smaller than that of Wang et al. (2011a) who report a rate of 30%. This difference may be partially due to our lower sensitivity − average rms 0.69 mJy instead of 0.52 mJy for the Wang et al. sources with m1450 > 20.2. However, there is certainly also an effect of the larger bolometric luminosities of their sample, as discussed in Sect. 4.
3. Far-infrared luminosities
3.1. Estimates of LFIR and Mdust
One may convert the 250 GHz flux densities - corresponding to λrest ~ 170 μm − to FIR luminosities by assuming a model for the FIR SED. For homogeneity, we take the same assumptions as Wang et al. (2008, 2011a) for this SED, i.e. assume an optically thin graybody with a dust temperature of Td = 47 K and emissivity index of β = 1.6. As proposed by Beelen et al. (2006), these are typical values for the FIR luminous quasars at z ~ 2−4. We also select the same wavelength range, 42.5−122.5 μm, for the definition of the FIR luminosity as Wang et al. (2008, 2011a). Values of LFIR thus calculated for detected or tentatively detected sources are reported in Table 2. For the average redshift of our sample, ⟨ z ⟩ = 6.09, the conversion factor between the average values of the 250 GHz flux density and LFIR is  (1)For other redshifts the conversion factor is slightly different, varying from 2.35 for z = 5.88 to 2.16 for z = 6.43. However, we note that our faint sources have much lower mm fluxes than the typical sources used to determine the dust temperature value Td = 47 K. If our sources instead have parameters closer to those of nearby luminous infrared galaxies (LIRGs, 1011−1012 L⊙,Td ≈ 33 K, U et al. 2012), then the values of LFIR would be ~3 times lower for Td = 33 K.
The dust mass Mdust at Tdust is related to the FIR luminosity by  , where Bν is the Planck function and κν = κ0(ν/ν0)β is the dust absorption coefficient. Using κ0 = 18.75 cm2 g-1 at 125 μm (Hildebrand 1983) as do Wang et al. (2008, 2011a), yields
  (2)For Td = 33 K, the values of Mdust would be ~7 times larger than for Td = 47 K for the same LFIR (~2.4 times larger for the same S250 GHz).
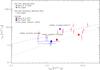 |
Fig. 1 Similar to Fig. 4 of Wang et al. (2011a). FIR and bolometric luminosity correlations of z ~ 6 quasars, showing: 1) average luminosities (large symbols) for: 1a) our whole sample of 20 sources and that of 19 sources taking out CFHQS J1429+5447 (the horizontal error bars contain 80% of the data points of these samples, excluding the two highest and lowest values of Lbol); 1b) average values of Wang et al. (2011a) for optically faint (m1450 ≥ 20.2) and bright (m1450 < 20.2) sources; 2) individual luminosities (small symbols) for our 250 GHz detections and tentative detections, together with the detections of Wang et al. (2008) for comparison. Note that for CFHQS J1429+5447, the value used for LFIR corresponds to the totality of the measured 250 GHz flux density, while only an unknown part is emitted by the starburst dust in the quasar host galaxy. The two straight lines are reproduced from Fig. 4 of Wang et al. (2011a): the dotted line [log (LFIR) = 0.62log (Lbol) + 3.9] is a power-law fit to the average luminosities of all the quasar high-z samples, and the dashed line [log (LFIR) = 0.45log (Lbol) + 6.6] shows the power-law fit to the sub-millimeter- or millimeter-detected quasars in all high-z samples and local ultra-luminous infrared galaxies (ULIRGs). To be consistent with our selected bolometric conversion factor ζ1450A = 4.4 (Sect. 2), we have scaled all the values used by Wang et al. for Lbol using our bolometric conversion factor instead of ζ1450A ≈ 6 which we inferred from Table 4 and Fig. 4 of Wang et al. (2011a). |
3.2. Average FIR luminosities
Considering the small number of 1.2 mm detections, we use the additional information provided by the averages derived from various stacking of the observed 1.2 mm flux densities. However, some care must be taken in calculating these averages because of the inhomogeneity of our data. Because the redshift range of our sample is small, it is simpler to perform all the averages on the 1.2 mm flux density, S250 GHz, and to infer the corresponding average of LFIR by using the conversion factor of Eq. (1) for the average redshift 6.09. We will consider the following various averages of S250 GHz:
-
a) Classical rms weighted averages with weights proportional to1/rms2. However, this could give too much weight to the two sources with rms <0.4 mJy whose integration time was anomalously long. It seems better to replace their rms by a typical value − median of the rms of the other sources (regularized rms).
-
b) Plain, straight average of the nominal values of S250 GHz with equal weights irrespective of the rms. However, this does not take into account the difference in quality of these values. Therefore, we give the result of this straight average in Table 2 discarding the two sources whose 250 GHz rms are peculiarly large.
-
c) As there is clearly one exceptional source, CFHQS J1429+5447, which is more than three times stronger at 1.2 mm than all the others, and is radio loud (Sect. 3.3), one may prefer to exclude it, stacking only the 19 other sources with weights as in a).
-
d) One might also exclude the two other tentative detections, stacking only 17 sources with weights as in a).
-
e) and f) One may try to split the sample into two halves with respect to the UV luminosity to see whether the UV luminosity can have some visible effect on ⟨ S250 GHz ⟩.
In Table 2, we give the results corresponding to all these options. It is seen that the results of the first two do not differ significantly. As expected, dropping CFHQS J1429+5447 leads to a decrease of the average flux density, yielding ⟨ S250 GHz ⟩ = 0.41 ± 0.14 for the rms weighted average of the 19 other sources. This is probably the best average for the most representative sources of our sample, but at 2.9σ it is hardly meaningful. In addition, small residual systematic errors in MAMBO results are not excluded at this level.
Note that the average of log (LFIR) (or S250 GHz) for groups e) and f) is found to be about the same even though these groups are split by luminosity. This may appear surprising because one may expect to see a decrease of ⟨LFIR⟩ with ⟨Lbol⟩ in line with the results of Wang et al. (2011a, see lower dotted line in Fig. 1). However this can be easily explained by the fact that we do not have a huge luminosity range in our sample. The average ⟨Lbol⟩ of these groups differ by a factor of 4 and the medians less than a factor of 2. Given that each stack is detected at only S/N ~ 2, our results are consistent with the relation of Wang et al.
3.3. CFHQS J142952.17+544717.6
This quasar is the only one detected at 1.2 mm with a high S/N ratio, S250 GHz = 3.46 ± 0.52 mJy. The corresponding values of the FIR luminosity and the dust mass are reported in Table 2. Besides being one of the mm-brightest z ~ 6 quasars and one of the UV most luminous of our sample, it is remarkable in many other respects. It is one of the only four known radio-loud z ~ 6 quasars (see e.g., Frey et al. 2011) and has the highest redshift and strongest radio emission among them. The Extended Very Large Array (EVLA) observation of its CO(2−1) line (Wang et al. 2011b), prompted by our 1.2 mm result, has shown a strong CO emission resolved in two peaks, one on top of the quasar position and the other 1.2′′ away. Each corresponds to a gas mass larger than 1010 M⊙. The value of the ratio of the FIR to CO luminosities, LFIR/ , is just below the average of this ratio for the z ~ 6 quasars where Wang et al. (2010) have detected CO. This indicates that most of the 1.2 mm continuum emission probably comes from dust and not from the radio source. The radio source is compact and has a very steep radio spectrum (3.03 ± 0.005, 0.99 ± 0.006 and 0.257 ± 0.015 mJy at 1.6, 5, and 32 GHz, respectively; Frey et al. 2011; Wang et al. 2011b). This is another indication that most of the millimeter emission is due to dust, although a significant synchrotron contribution cannot be fully excluded. Moreover, it is not yet known how the observed 250 GHz flux density is shared between the dust emission of each galaxy, and possibly the synchrotron emission of the quasar. Therefore, in Table 2 and Fig. 1 the value of LFIR corresponds to the totality of the measured 250 GHz flux density, while only an unknown part is emitted by the starburst dust in the quasar host galaxy.
4. Discussion and conclusions
The most natural explanation for an excess of FIR emission is star formation. If the FIR emission is powered by a dusty starburst, there is a direct relation between SFR and LFIR. The most generally used relation is given by Kennicutt (1998), SFR(M⊙/yr) = 1.72 × 10⁻¹⁰LFIR(L⊙) for a Salpeter IMF and 8 < λ < 1000 μm. However, the exact conversion factor significantly depends on the IMF and the selected wavelength range for estimating LFIR. With our selected wavelength range, 42.5−122.5 μm, it is conservative to assume that SFR(M⊙/yr) ≳ 1.5 × 10⁻¹⁰ LFIR(L⊙).
For sources with large FIR excess, such as CFHQS J1429+5447, it is generally agreed that most of the FIR emission is powered by a starburst (see e.g., Beelen et al. 2006; Wang et al. 2008; Mor et al. 2012). This yields SFR ≳ 500 M⊙/yr for each of the two galaxies of CFHQS J1429+5447. For the other sources, making the assumption that all the FIR emission is due to star formation, the value for group c in Table 2, ⟨ LFIR ⟩ ≈ 0.94 ± 0.32 × 10¹² L⊙, would imply SFR ≳ 140 ± 50 M⊙/yr.
For the much smaller FIR emission of the majority of quasars, an important starburst contribution is also likely; however, it is possible that a portion also comes from dust powered by the AGN. This was pointed out for z ~ 6 quasars by Wang et al. (2011a). They extended their discussion to lower redshifts and they quote various other authors who also discuss lower redshifts (see also e.g., Rosario et al. 2012; Dai et al. 2012, for more recent references). In their Fig. 4, (partially reproduced in Fig. 1), they have shown that there is a remarkably uniform correlation of LFIR with Lbol for quasar average luminosities, both for various samples of high-z quasars, and of low-z ones (e.g., Hao et al. 2005). This correlation is well represented by the power law [log (LFIR) = 0.62 × log (Lbol) + 3.9] (see Fig. 1). A starburst contribution is needed to explain the FIR slope of 0.6, while the slopes for IRAS 12 μm and 25 μm of local quasars are linear and consistent with AGN heating (Hao et al. 2005). However, this relatively high value of 0.6 for the FIR slope may be evidence for a combination of AGN and starburst contributions.
In Fig. 1, which is similar to Fig. 4 of Wang et al. (2011a), we show the correlations for our sample between LFIR and Lbol, computed as described above (Sect. 2). Comparing the plotted average luminosities for all our 20 sources, with and without CFHQS J1429+5447, to the averages of Wang et al. (2011a) for m1450 < 20.2 and >20.2, shows that our sample represents a significant extension to the work of Wang et al. toward optically weaker sources. Our average for all 20 observed sources, including CFHQS J1429+5447, appears consistent with the two averages of Wang et al. for all the z ~ 6 quasars they observed, respectively optically faint and bright. The average for our 19 sources, without CFHQS J1429+5447, is in better agreement with the power-law fit that Wang et al. found for the average luminosities of all the high-z samples of quasars observed in millimeter.
The position of CFHQS J1429+5447 in Fig. 1 is well within the region of 1.2 mm detected sources by Wang et al. (2008, 2011a). Finally in Fig. 1 we have added the positions of the two tentatively detected sources at 1.2 mm, CFHQS J0033−0125 (S/N = 3.1) and CFHQS J010250-0218 (S/N = 2.7). They are again close to the line fitting mm-detected sources.
In conclusion, our 1.2 mm observations confirm the results of Wang et al. (2011) about the FIR emision of z ~ 6 quasars and extend them toward optically fainter sources. The core of our sample is made of faint sources,  , corresponding to Lbol ~ (0.5−1) × 1013 L⊙ and black-hole masses of a few 108 M⊙ (Willott et al. 2010b). For these quasars, the average FIR luminosity is weak, but probably still significant ⟨ LFIR ⟩ ≈ 0.94 ± 0.32 × 10¹² L⊙. This corresponds to an average star formation rate of a few 100 M⊙/yr. However, there is certainly a large dispersion for individual sources around
these average values − at least a factor ~3 in both directions, as exemplified by our two tentative 1.2 mm detections, CFHQS J0033−0125 and CFHQS J0102-0218, in this Lbol range, and the very low 1.2 mm flux density measured with ALMA for two CFHQS quasars (Willott et al. 2013).
Star-formation rates at such low levels probably reflect the fact that both the gas mass and the total mass of the host galaxy are small. This should then favor large ratios MBH/Mgalaxy, which could be significantly larger than the typical ratio at z = 0 (MBH/Mbulge ≈ 0.0014; Marconi & Hunt 2003). But ratios like these remain very uncertain in the absence of direct measurements of Mgas and Mgalaxy, e.g., by CO or C+ observations (e.g., Wang et al. 2011b, 2012; Willott et al. 2013).
Acknowledgments
We thank T. Forveille and X. Delfosse for useful discussions. Based on observations with the IRAM 30 m MRT at Pico Veleta. IRAM is supported by INSU/CNRS (France), MPG (Germany) and IGN (Spain). Thanks to the queue observers at IRAM who obtained data for this paper. Thanks to INSU for the financial support for G. Orellana’s visit to France. Based on observations obtained with MegaPrime/MegaCam, a joint project of CFHT and CEA/DAPNIA, at the Canada-France-Hawaii Telescope (CFHT) which is operated by the National Research Council (NRC) of Canada, the Institut National des Sciences de l’Univers of the Centre National de la Recherche Scientifique (CNRS) of France, and the University of Hawaii. This work is based in part on data products produced at TERAPIX and the Canadian Astronomy Data Centre as part of the Canada-France-Hawaii Telescope Legacy Survey, a collaborative project of NRC and CNRS.
References
- Beelen, A., Cox, P., Benford, D. J., et al. 2006, ApJ, 642, 694 [NASA ADS] [CrossRef] [Google Scholar]
- Begelman, M. C., Volonteri, M., & Rees, M. J. 2006, MNRAS, 370, 289 [NASA ADS] [CrossRef] [Google Scholar]
- Carilli, C. L., Bertoldi, F., Rupen, M. P., et al. 2001, ApJ, 555, 625 [NASA ADS] [CrossRef] [Google Scholar]
- Dai, Y., Bergeron, J., Elvis, M., et al. 2012, ApJ, 753, 33 [NASA ADS] [CrossRef] [Google Scholar]
- Fan, X., Strauss, M. A., Becker, R. H., et al. 2006, AJ, 132, 117 [NASA ADS] [CrossRef] [EDP Sciences] [Google Scholar]
- Frey, S., Paragi, Z., Gurvits, L. I., Gabányi, K. É., & Cseh, D. 2011, A&A, 531, L5 [NASA ADS] [CrossRef] [EDP Sciences] [Google Scholar]
- Hao, C. N., Xia, X. Y., Mao, S., Wu, H., & Deng, Z. G. 2005, ApJ, 625, 78 [NASA ADS] [CrossRef] [Google Scholar]
- Hildebrand, R. H. 1983, Quarterly J. Royal Astron. Soc., 24, 267 [Google Scholar]
- Jiang, L., Fan, X., Vestergaard, M., et al. 2007, AJ, 134, 1150 [NASA ADS] [CrossRef] [Google Scholar]
- Jiang, L., Fan, X., Bian, F., et al. 2008, AJ, 135, 1057 [NASA ADS] [CrossRef] [Google Scholar]
- Jiang, L., Fan, X., Annis, J., et al. 2009, AJ, 138, 305 [NASA ADS] [CrossRef] [Google Scholar]
- Kennicutt, R. C., Jr. 1998, ARA&A, 36, 189 [Google Scholar]
- Komatsu, E., Dunkley, J., Nolta, M. R., et al. 2009, ApJS, 180, 330 [NASA ADS] [CrossRef] [Google Scholar]
- Kreysa, E., Gemuend, H.-P., Gromke, J., et al. 1998, Proc. SPIE, 3357, 319 [NASA ADS] [CrossRef] [Google Scholar]
- Kurk, J. D., Walter, F., Fan, X., et al. 2007, ApJ, 669, 32 [NASA ADS] [CrossRef] [Google Scholar]
- Marconi, A., & Hunt, L. K. 2003, ApJ, 589, L21 [NASA ADS] [CrossRef] [Google Scholar]
- Mor, R., Netzer, H., Trakhtenbrot, B., Shemmer, O., & Lira, P. 2012, ApJ, 749, L25 [NASA ADS] [CrossRef] [Google Scholar]
- Mortlock, D. J., Warren, S. J., Venemans, B. P., et al. 2011, Nature, 474, 616 [NASA ADS] [CrossRef] [PubMed] [Google Scholar]
- Omont, A., Cox, P., Bertoldi, F., et al. 2001, A&A, 374, 371 [NASA ADS] [CrossRef] [EDP Sciences] [Google Scholar]
- Omont, A., Beelen, A., Bertoldi, F., et al. 2003, A&A, 398, 857 [NASA ADS] [CrossRef] [EDP Sciences] [Google Scholar]
- Priddey, R. S., Isaak, K. G., McMahon, R. G., & Omont, A. 2003, MNRAS, 339, 1183 [NASA ADS] [CrossRef] [Google Scholar]
- Richards, G. T., Lacy, M., Storrie-Lombardi, L. J., et al. 2006, ApJS, 166, 470 [NASA ADS] [CrossRef] [Google Scholar]
- Rosario, D. J., Santini, P., Lutz, D., et al. 2012, A&A, 545, A45 [NASA ADS] [CrossRef] [EDP Sciences] [Google Scholar]
- U, V.,Sanders, D. B., Mazzarella, J. M., et al. 2012, ApJS, 203, 9 [NASA ADS] [CrossRef] [Google Scholar]
- Volonteri, M. 2012, Science, 337, 544 [NASA ADS] [CrossRef] [Google Scholar]
- Wang, R., Wagg, J., Carilli, C. L., et al. 2008, AJ, 135, 1201 [NASA ADS] [CrossRef] [Google Scholar]
- Wang, R., Carilli, C. L., Neri, R., et al. 2010, ApJ, 714, 699 [NASA ADS] [CrossRef] [Google Scholar]
- Wang, R., Wagg, J., Carilli, C. L., et al. 2011a, AJ, 142, 101 [NASA ADS] [CrossRef] [Google Scholar]
- Wang, R., Wagg, J., Carilli, C. L., et al. 2011b, ApJ, 739, L34 [NASA ADS] [CrossRef] [Google Scholar]
- Wang, R., Wagg, J., Carilli, C. L., et al. 2012 [arXiv:1210.0242] [Google Scholar]
- Willott, C. J., McLure, R. J., & Jarvis, M. J. 2003, ApJ, 587, L15 [NASA ADS] [CrossRef] [Google Scholar]
- Willott, C. J., Delorme, P., Omont, A., et al. 2007, AJ, 134, 2435 [NASA ADS] [CrossRef] [Google Scholar]
- Willott, C. J., Delorme, P., Reylé, C., et al. 2009, AJ, 137, 3541 [NASA ADS] [CrossRef] [Google Scholar]
- Willott, C. J., Delorme, P., Reylé, C., et al. 2010a, AJ, 139, 906 [NASA ADS] [CrossRef] [Google Scholar]
- Willott, C. J., Albert, L., Arzoumanian, D., et al. 2010b, AJ, 140, 546 [NASA ADS] [CrossRef] [Google Scholar]
- Willott, C. J., Omont, A., & Bergeron, J. 2013, ApJ, submitted [arXiv:1302.1587] [Google Scholar]
- Zylka, R. 1998, MOPSI Users Manual (Grenoble: IRAM) [Google Scholar]
All Tables
All Figures
|
Fig. 1 Similar to Fig. 4 of Wang et al. (2011a). FIR and bolometric luminosity correlations of z ~ 6 quasars, showing: 1) average luminosities (large symbols) for: 1a) our whole sample of 20 sources and that of 19 sources taking out CFHQS J1429+5447 (the horizontal error bars contain 80% of the data points of these samples, excluding the two highest and lowest values of Lbol); 1b) average values of Wang et al. (2011a) for optically faint (m1450 ≥ 20.2) and bright (m1450 < 20.2) sources; 2) individual luminosities (small symbols) for our 250 GHz detections and tentative detections, together with the detections of Wang et al. (2008) for comparison. Note that for CFHQS J1429+5447, the value used for LFIR corresponds to the totality of the measured 250 GHz flux density, while only an unknown part is emitted by the starburst dust in the quasar host galaxy. The two straight lines are reproduced from Fig. 4 of Wang et al. (2011a): the dotted line [log (LFIR) = 0.62log (Lbol) + 3.9] is a power-law fit to the average luminosities of all the quasar high-z samples, and the dashed line [log (LFIR) = 0.45log (Lbol) + 6.6] shows the power-law fit to the sub-millimeter- or millimeter-detected quasars in all high-z samples and local ultra-luminous infrared galaxies (ULIRGs). To be consistent with our selected bolometric conversion factor ζ1450A = 4.4 (Sect. 2), we have scaled all the values used by Wang et al. for Lbol using our bolometric conversion factor instead of ζ1450A ≈ 6 which we inferred from Table 4 and Fig. 4 of Wang et al. (2011a). |
| In the text | |
Current usage metrics show cumulative count of Article Views (full-text article views including HTML views, PDF and ePub downloads, according to the available data) and Abstracts Views on Vision4Press platform.
Data correspond to usage on the plateform after 2015. The current usage metrics is available 48-96 hours after online publication and is updated daily on week days.
Initial download of the metrics may take a while.