Fig. 1
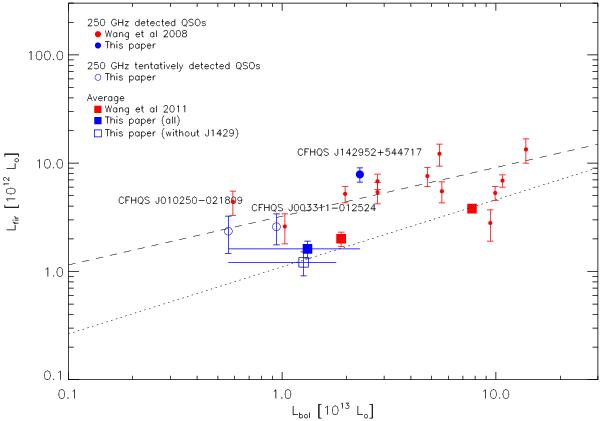
Similar to Fig. 4 of Wang et al. (2011a). FIR and bolometric luminosity correlations of z ~ 6 quasars, showing: 1) average luminosities (large symbols) for: 1a) our whole sample of 20 sources and that of 19 sources taking out CFHQS J1429+5447 (the horizontal error bars contain 80% of the data points of these samples, excluding the two highest and lowest values of Lbol); 1b) average values of Wang et al. (2011a) for optically faint (m1450 ≥ 20.2) and bright (m1450 < 20.2) sources; 2) individual luminosities (small symbols) for our 250 GHz detections and tentative detections, together with the detections of Wang et al. (2008) for comparison. Note that for CFHQS J1429+5447, the value used for LFIR corresponds to the totality of the measured 250 GHz flux density, while only an unknown part is emitted by the starburst dust in the quasar host galaxy. The two straight lines are reproduced from Fig. 4 of Wang et al. (2011a): the dotted line [log (LFIR) = 0.62log (Lbol) + 3.9] is a power-law fit to the average luminosities of all the quasar high-z samples, and the dashed line [log (LFIR) = 0.45log (Lbol) + 6.6] shows the power-law fit to the sub-millimeter- or millimeter-detected quasars in all high-z samples and local ultra-luminous infrared galaxies (ULIRGs). To be consistent with our selected bolometric conversion factor ζ1450A = 4.4 (Sect. 2), we have scaled all the values used by Wang et al. for Lbol using our bolometric conversion factor instead of ζ1450A ≈ 6 which we inferred from Table 4 and Fig. 4 of Wang et al. (2011a).
Current usage metrics show cumulative count of Article Views (full-text article views including HTML views, PDF and ePub downloads, according to the available data) and Abstracts Views on Vision4Press platform.
Data correspond to usage on the plateform after 2015. The current usage metrics is available 48-96 hours after online publication and is updated daily on week days.
Initial download of the metrics may take a while.