Free Access
Fig. 5
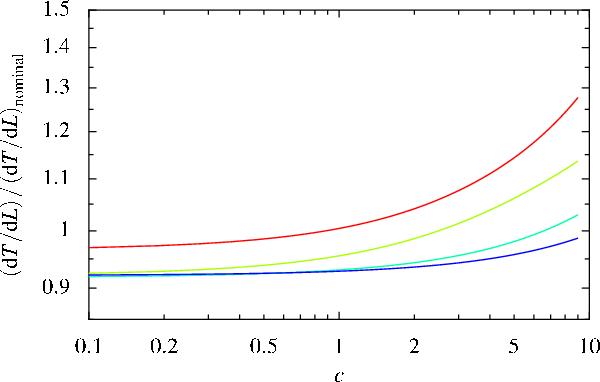
Relative change in the model phase correction coefficients for a 5% shift in the centre frequency of each filter versus the total column of water vapour in mm. Red to blue lines (following the spectrum) are channels 1 to 4.
Current usage metrics show cumulative count of Article Views (full-text article views including HTML views, PDF and ePub downloads, according to the available data) and Abstracts Views on Vision4Press platform.
Data correspond to usage on the plateform after 2015. The current usage metrics is available 48-96 hours after online publication and is updated daily on week days.
Initial download of the metrics may take a while.