Fig. 4
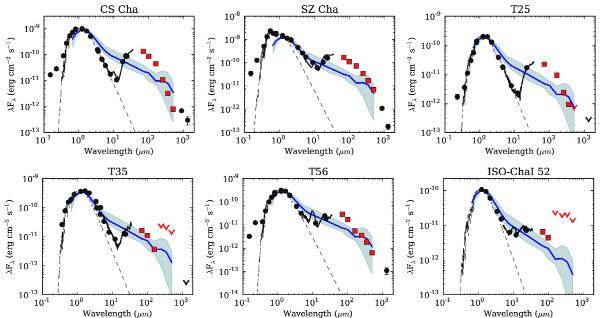
SEDs of the detected transitional disk candidates, confirmed by our classification criterion and updated with the fluxes from Herschel. Black dots are the dereddened observed values from the literature, downward black arrows are flux upper limits from the literature. Herschel data are represented in red (squares for detections, downward arrows for upper limits). Uncertainties are within symbol sizes. The IRS spectra from Manoj et al. (2011) (black solid lines) and the photospheres (dashed black lines from the NextGen models from Allard et al. 2012) are also plotted. The median Class II SED (blue solid line) and the first and fourth quartiles (blue area) are shown (see also Sect. 4 and Table 3).
Current usage metrics show cumulative count of Article Views (full-text article views including HTML views, PDF and ePub downloads, according to the available data) and Abstracts Views on Vision4Press platform.
Data correspond to usage on the plateform after 2015. The current usage metrics is available 48-96 hours after online publication and is updated daily on week days.
Initial download of the metrics may take a while.