Fig. 8
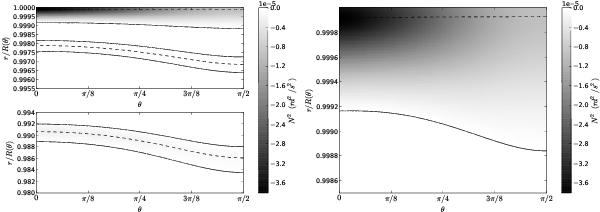
Convectively unstable layers in the outer layers of Vega’s model as shown by the squared Brunt-Väisälä frequencyN2. Left: a general view showing the regions where N2 < 0. These are limited by the solid lines. In the top panel, there are two convective layers, and the shallowest one reaches the surface of the star. The dashed line marks the minimum of N2. The layers associated with helium ionization region clearly appear. Left: closer view of the surface layer. The grey scale represents the values of N2 in squared radians per second.
Current usage metrics show cumulative count of Article Views (full-text article views including HTML views, PDF and ePub downloads, according to the available data) and Abstracts Views on Vision4Press platform.
Data correspond to usage on the plateform after 2015. The current usage metrics is available 48-96 hours after online publication and is updated daily on week days.
Initial download of the metrics may take a while.