Fig. 8
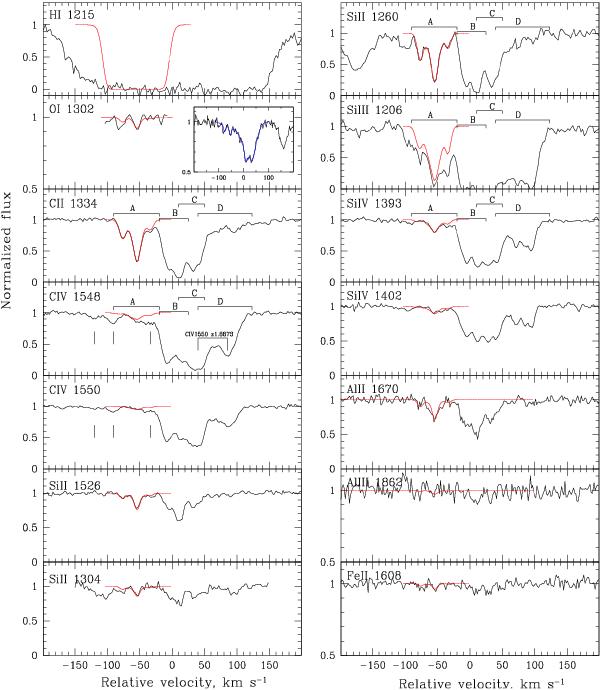
High-resolution lines observed in the z = 1.8916 system. Brackets indicate the sub-systems A, B, C, and D with strong lines, vertical ticks in the C iv panels point to superimposed sub-systems with weak absorption lines. The synthetic profiles for metal ions (red) in the sub-system A are calculated with broken power-law SEDs from the grey shadowed area in Fig. 10. The black line in the O i panel is a restored profile from the forest absorption shown in the insert. The black and blue curves in the insert are the original and deconvolved profiles, respectively.
Current usage metrics show cumulative count of Article Views (full-text article views including HTML views, PDF and ePub downloads, according to the available data) and Abstracts Views on Vision4Press platform.
Data correspond to usage on the plateform after 2015. The current usage metrics is available 48-96 hours after online publication and is updated daily on week days.
Initial download of the metrics may take a while.