Free Access
Fig. 6
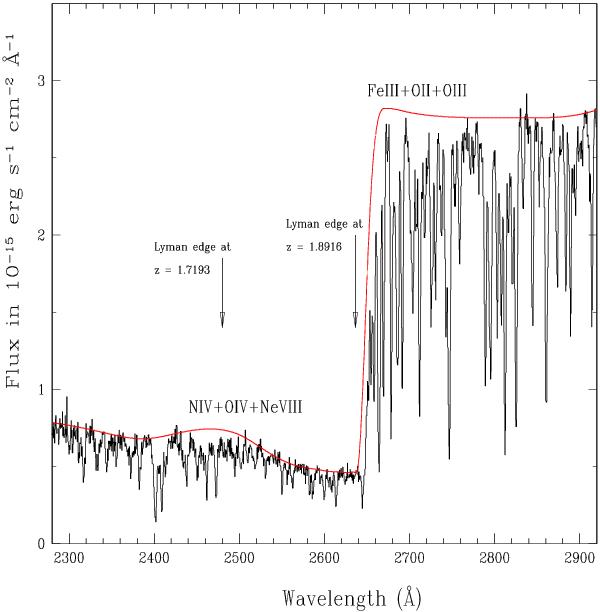
Observed flux of HS 1103+6416 obtained with the FOS and GHRS onboard the HST. The arrows mark the H i Lyman limits for the z = 1.8916 and z = 1.7193 systems.
Current usage metrics show cumulative count of Article Views (full-text article views including HTML views, PDF and ePub downloads, according to the available data) and Abstracts Views on Vision4Press platform.
Data correspond to usage on the plateform after 2015. The current usage metrics is available 48-96 hours after online publication and is updated daily on week days.
Initial download of the metrics may take a while.