Free Access
Fig. 5
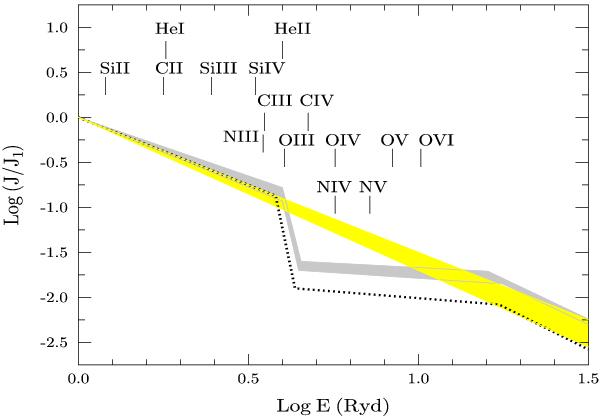
SEDs complying with the line profiles from the zabs = 1.9410 system: yellow cone plots simple power laws, Jν ∝ ν− α, with α = 1.5–1.7; grey shadowed area marks broken power laws with a break at 4 Ryd. The black dotted line shows an initial shape used in the SED adjustment procedure.
Current usage metrics show cumulative count of Article Views (full-text article views including HTML views, PDF and ePub downloads, according to the available data) and Abstracts Views on Vision4Press platform.
Data correspond to usage on the plateform after 2015. The current usage metrics is available 48-96 hours after online publication and is updated daily on week days.
Initial download of the metrics may take a while.