Fig. 4
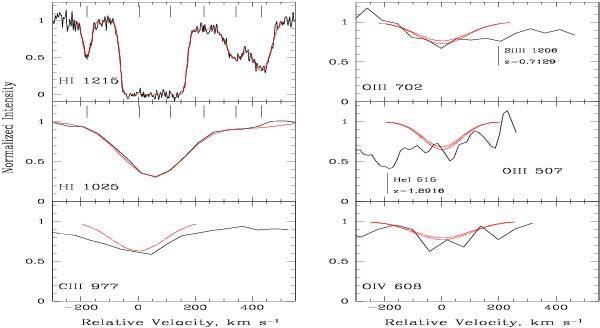
Low-resolution lines (HST) from the zabs = 1.9410 system. The vertical ticks in the H i panels indicate the positions of individual Voigt components. The profiles of metal ions are calculated using the velocity-density distributions restored on the basis of high-resolution lines shown in Fig. 3. The red synthetic profiles in the O iii and O iv panels are calculated for two oxygen abundances [O/C] = 0.2 and 0.3 (see text for details).
Current usage metrics show cumulative count of Article Views (full-text article views including HTML views, PDF and ePub downloads, according to the available data) and Abstracts Views on Vision4Press platform.
Data correspond to usage on the plateform after 2015. The current usage metrics is available 48-96 hours after online publication and is updated daily on week days.
Initial download of the metrics may take a while.