Fig. 3
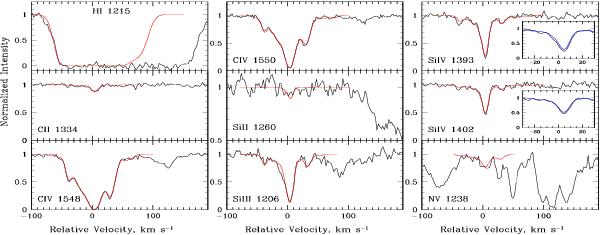
High-resolution hydrogen and metal absorption lines associated with the zabs = 1.9410 system toward HS 1103+6416 (black curves). The synthetic profiles calculated with the UV SEDs shown by the shadowed area in Fig. 5 are plotted by red curves. The zero radial velocity is fixed at z = 1.9410. The inserted figures in Si iv panels display the synthetic spectra (blue curves) calculated with the first-guess SED (red dotted line in Fig. 5).
Current usage metrics show cumulative count of Article Views (full-text article views including HTML views, PDF and ePub downloads, according to the available data) and Abstracts Views on Vision4Press platform.
Data correspond to usage on the plateform after 2015. The current usage metrics is available 48-96 hours after online publication and is updated daily on week days.
Initial download of the metrics may take a while.