Fig. 2
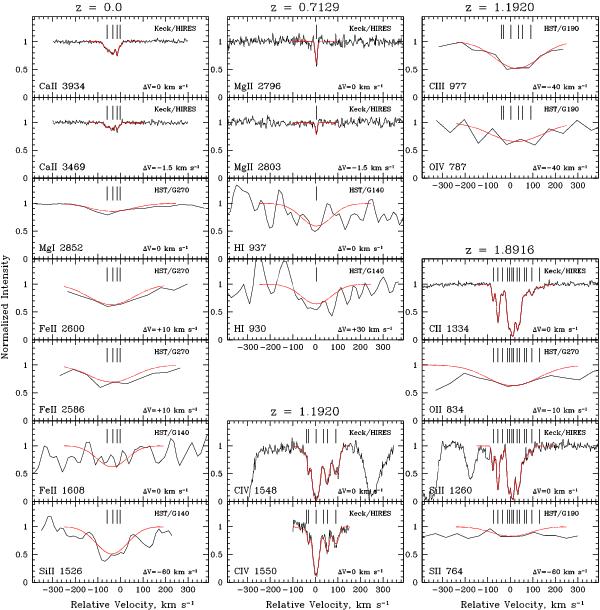
Calibration-induced shifts of the observed profiles illustrated by spectral lines from different absorption systems. The velocity structure is estimated on the basis of lines from the high-resolution (Keck/HIRES) part of the HS 1103+6416 spectrum and then applied to calculate the profiles from low-resolution (HST) parts. The synthetic profiles are shown by red, the vertical ticks mark positions of sub-components. ΔV indicates the velocity shift applied to the observed profile to align it with a reference line from the Keck spectrum.
Current usage metrics show cumulative count of Article Views (full-text article views including HTML views, PDF and ePub downloads, according to the available data) and Abstracts Views on Vision4Press platform.
Data correspond to usage on the plateform after 2015. The current usage metrics is available 48-96 hours after online publication and is updated daily on week days.
Initial download of the metrics may take a while.