Fig. 3
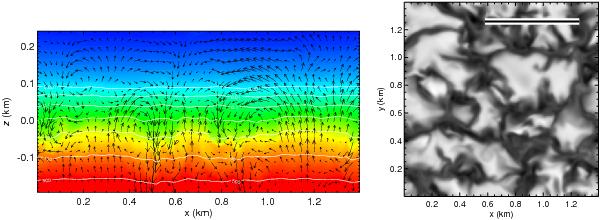
Snapshot of the 3D white dwarf simulation at Teff ~ 8000 K and log g = 8. Left: temperature structure for a slice in the horizontal-vertical xz plane through a box with coordinates x,y,z (in km). The temperature is colour coded from 14 000 (red) to 3000 K (blue). The arrows represent relative convective velocities, while thick lines correspond to contours of constant Rosseland optical depth, with values given in the figure. Right: emergent bolometric intensity at the top of the horizontal xy plane. The rms intensity contrast with respect to the mean intensity is 7.6%. The length of the bar in the top right is 10 times the pressure scale height at τR = 2/3.
Current usage metrics show cumulative count of Article Views (full-text article views including HTML views, PDF and ePub downloads, according to the available data) and Abstracts Views on Vision4Press platform.
Data correspond to usage on the plateform after 2015. The current usage metrics is available 48-96 hours after online publication and is updated daily on week days.
Initial download of the metrics may take a while.