Fig. 16
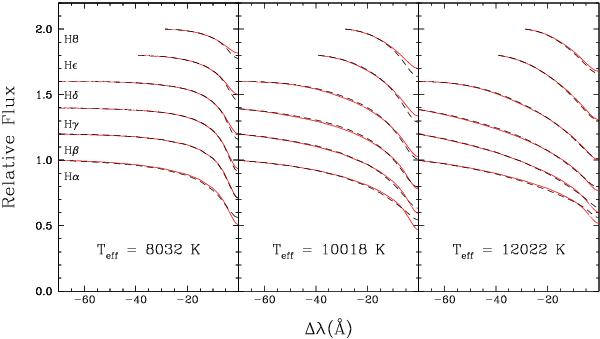
Comparison of the blue wing of six Balmer line profiles (Hα to H8) calculated from ⟨ 3D ⟩ structures (red, solid) and standard 1D structures (black, dashed) for three models from our sequence identified in Table 2. Teff values are shown on the different panels. All line profiles were normalized to a unity continuum at a fixed distance from the line centre. All spectra were convolved with a Gaussian profile with a resolution of 6 Å to represent typical observations.
Current usage metrics show cumulative count of Article Views (full-text article views including HTML views, PDF and ePub downloads, according to the available data) and Abstracts Views on Vision4Press platform.
Data correspond to usage on the plateform after 2015. The current usage metrics is available 48-96 hours after online publication and is updated daily on week days.
Initial download of the metrics may take a while.